Custom Cost Explorer Dashboards: Step-by-Step Guide
Step-by-step setup for AWS Cost Explorer dashboards: enable Cost Explorer, activate tags, add widgets, and automate shared reports.
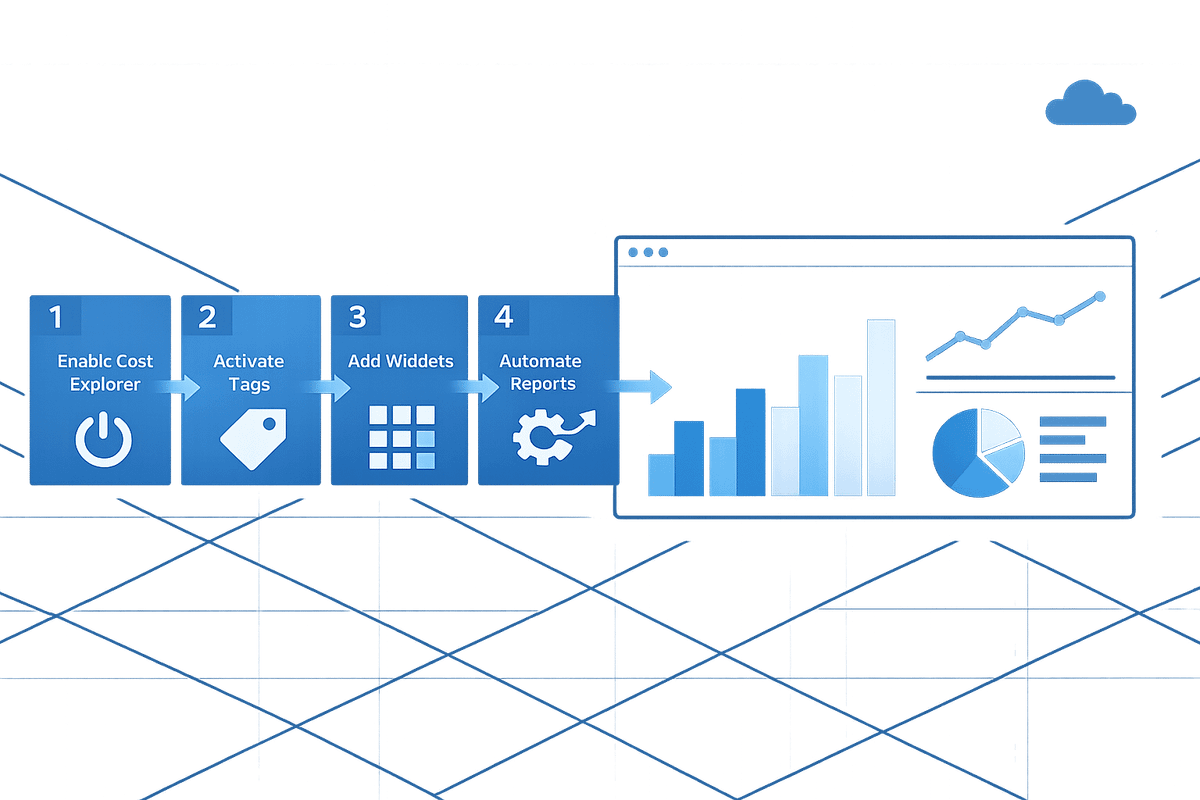
AWS Cost Explorer dashboards simplify cloud cost management by turning billing data into actionable insights. Here's what you need to know:
- What they do: Provide a single-page view of AWS costs and usage with up to 20 visualisations, such as daily costs, spending by service, or departmental usage.
- Why they matter: Help small and medium-sized businesses (SMBs) track spending trends, identify cost spikes, and optimise resources.
- Key features:
- Customisable widgets and layouts
- Secure sharing across AWS accounts
- Automated PDF report delivery (daily, weekly, or monthly)
- No additional cost for setup or use
Getting Started
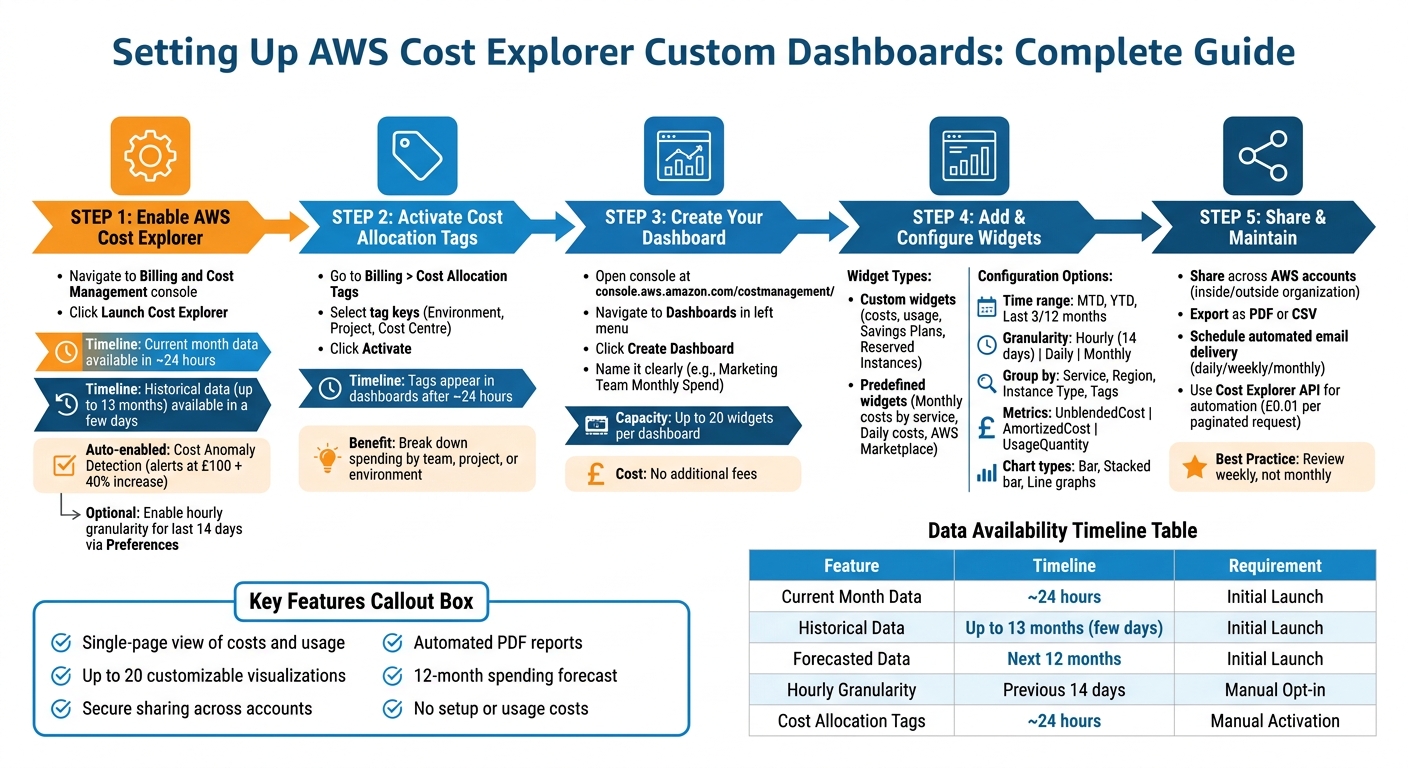
- Enable AWS Cost Explorer: Activate via the Billing and Cost Management console. Data processing takes ~24 hours for current month data and a few days for historical data.
- Activate Cost Allocation Tags: Categorise costs by team, project, or environment for detailed tracking.
Creating Dashboards
- Navigate to the Dashboards section in the AWS console.
- Add widgets for metrics like monthly costs or Reserved Instances usage.
- Customise filters (e.g., by service or region) and visual formats (bar, line, or stacked charts).
Sharing and Maintenance
- Share dashboards across accounts or export them as PDFs/CSV files.
- Use the Cost Explorer API for automated workflows.
- Review dashboards weekly to catch potential overspending early.
Cost Explorer dashboards are a practical way to manage AWS expenses, helping SMBs make informed financial decisions. With no extra fees, they’re an accessible tool for businesses of all sizes.
AWS Cost Explorer Dashboard Setup: Complete Step-by-Step Process
Monitoring Costs with AWS Cost Explorer Step-by-step
sbb-itb-0f2792e
Prerequisites for Setting Up Custom Dashboards
To ensure AWS can populate your visualisations and organise costs effectively for your business, there are two key tasks to complete: enabling AWS Cost Explorer and activating cost allocation tags. These steps will ensure smooth data visualisation and detailed cost tracking.
Enabling AWS Cost Explorer
Start by enabling Cost Explorer through the AWS Billing and Cost Management console. Simply navigate to Cost Explorer in the side menu and click Launch Cost Explorer.
Once activated, AWS will process your data. Current month data becomes available in about 24 hours, while historical data (up to 13 months) may take a few days to appear. Additionally, AWS generates a 12-month spending forecast automatically. If you're using a member account, double-check that the organisation's management account hasn’t restricted your access to Cost Explorer.
By default, Cost Anomaly Detection is enabled. This feature uses machine learning to alert you if spending exceeds £100 and reflects a 40% increase over expected patterns. For small and medium-sized businesses keeping a close eye on budgets, these alerts can help identify potential issues early.
For those needing hourly-level data for the past 14 days, you’ll need to manually opt in via the Cost Explorer Preferences page. Make sure you enable Cost Explorer at least 24 hours before creating dashboards to allow time for data processing.
With Cost Explorer set up and data processing underway, you can move on to activating cost allocation tags for more granular cost tracking.
Activating Cost Allocation Tags
Cost allocation tags allow you to break down spending by categories like team, project, or environment.
To activate these tags, go to Billing > Cost Allocation Tags in the AWS Management Console. Select the tag keys you want to use (e.g., Environment, Project, or Cost Centre) and click Activate. Once activated, these tags will appear as filters in your dashboards after approximately 24 hours.
Without these tags, your dashboards will only show overall spending totals. With them, you can filter costs by specific projects, compare usage across departments, or pinpoint which environments are contributing most to your AWS bill. The cost allocation coverage widget on the Billing and Cost Management home page can help you identify resources that lack tags, improving accountability within your organisation.
Below is a handy summary of data availability timelines and requirements for reference:
| Feature | Availability/Timeline | Requirement |
|---|---|---|
| Current Month Data | ~24 hours after enabling | Initial Launch |
| Historical Data | Up to 13 months (takes a few days) | Initial Launch |
| Forecasted Data | Next 12 months | Initial Launch |
| Hourly Granularity | Previous 14 days | Manual Opt-in (Management Account) |
| Cost Allocation Tags | ~24 hours after activation | Manual Activation in Billing Console |
Creating Your First Custom Dashboard
Now that you've completed the setup steps, it's time to create a personalised dashboard to help track and visualise your AWS costs.
Navigating to the Dashboard Section
Start by opening the AWS Billing and Cost Management console at https://console.aws.amazon.com/costmanagement/. Once there, locate Dashboards in the navigation pane on the left-hand side. This is your hub for building and managing custom dashboards.
Before proceeding, confirm that Cost Explorer is enabled. Dashboards rely on it to populate widgets. If you're part of an AWS Organisation, ensure that Cost Explorer is activated across all member accounts.
Setting Up a New Dashboard
Click on Create Dashboard and assign it a name that clearly reflects its purpose. For example, names like "Marketing Team Monthly Spend" or "Production Environment Costs" make it easy to identify later.
You can also add a description to provide additional context for your team. Each dashboard supports up to 20 widgets, offering flexibility to include a variety of visualisations. Start with predefined widgets like "Monthly costs by service" or "Daily costs", and customise their filters to align with your team's specific needs. This approach ensures your dashboard delivers actionable insights. Use the drag-and-drop functionality to rearrange widgets and prioritise the most critical metrics.
"Billing and Cost Management Dashboards enable you to create and share customised views of your cost and usage data in a single page." - AWS Documentation
The best part? Creating and using custom dashboards comes at no extra cost. This means you can experiment with different configurations without incurring additional charges. If you're unsure about permissions, ensure your IAM principal has the required permissions to view, list, create, update, and delete dashboards.
Adding and Configuring Widgets for Cost Visualisation
Understanding Widget Types
AWS provides two main types of widgets to help you analyse and keep track of your spending: Custom widgets and Predefined widgets.
- Custom widgets give you full control over what you monitor. Whether it’s costs, usage quantities, Savings Plans usage, or Reserved Instance coverage, you can tailor these widgets to focus on metrics that are most important to your business needs.
- Predefined widgets are ready-to-use templates designed for common use cases. Examples include "Monthly costs by service", "Daily costs", and "AWS Marketplace" expenses. These widgets save time by offering insights straight out of the box, without needing additional configuration.
Widgets also support different chart formats, such as bar, stacked bar, and line graphs, making it easier to visualise data. Typically, these charts highlight the top five cost-driving items individually, grouping the rest into an "Others" category to maintain clarity. If you’re comparing multiple services or accounts, stacked bar charts are especially helpful for understanding proportions at a glance.
Once you’re familiar with the available widget types, you can proceed to configure them to suit your specific cost-tracking needs.
Configuring Widgets
After selecting a widget type, the next step is configuring it to display the data you need most effectively.
Start by setting the time range. AWS offers several options, including Month to Date (MTD), Year to Date (YTD), or historical periods like "Last 3 Months" or "Last 12 Months". You can also overlay historical data with forecasted costs (up to 18 months ahead on a monthly basis) to assist with budget planning.
Choose the level of granularity that works best for your analysis. Options include:
- Hourly (available for the last 14 days with manual opt-in)
- Daily, which is useful for spotting spending spikes
- Monthly, for broader trends
The Group by function allows you to organise data by categories such as Service, Region, Instance Type, or Cost Allocation Tags. For example, grouping by "Usage Type" can help identify which resources are driving the highest costs.
Finally, select the metric you want to track:
- UnblendedCost shows the actual amount you paid.
- AmortizedCost spreads upfront reservation costs over time.
- UsageQuantity measures consumption in units like gigabytes or hours.
Organising Costs by Business Dimensions
Once your dashboard is set up, the next step is to organise costs by business dimensions. This approach helps you understand spending patterns more clearly.
Using Cost Allocation Tags
With cost allocation tags enabled, you can categorise AWS expenses by team, project, or environment. These tags apply only to costs incurred after activation.
In AWS Cost Explorer, the "Group by" feature lets you break down data by tag keys like "Project" or "Environment". Each tag value shows up as a separate element in the visualisation. Keep in mind that user-defined tags are prefixed with "user:", while AWS-generated tags use "aws:". For consistency, stick to a single naming convention - for example, use "BusinessUnit" instead of mixing terms like "BU" or "Dept". AWS Tag Editor can help you apply tags across multiple resources and regions.
Setting Up Cost Categories
Cost categories allow you to group accounts, services, or tags into logical business units. To create one, log in to the Billing and Cost Management console (available for management accounts only) and navigate to the Cost Categories section. Click "Create cost category", name it (e.g., "Department" or "Project"), and use the Rule Builder to define grouping criteria.
You can filter by dimensions such as Accounts, Services, or Tags, and even build hierarchical structures by nesting categories. For instance, "Teams" can be grouped under "Departments" to reflect your organisation's hierarchy. You can also set an effective date to apply rules retroactively, enabling analysis of past spending. Keep in mind it may take up to 24 hours for usage records to reflect updates.
Applying Filters for Detailed Analysis
Filters are a powerful way to zoom in on specific cost drivers. AWS Cost Explorer supports filters for dimensions like API operation, Region, Service, Tag, Instance type, and more. You can use up to 1,024 filters per report. Filters within the same dimension use "OR" logic (e.g., selecting multiple services), while filters across dimensions use "AND" logic.
For example, to focus on a specific project's EC2 costs, group by "Service" and filter using the "Project" tag. For deeper insights, enable resource-level data to filter by individual EC2 instance IDs. When analysing Reserved Instances or Savings Plans, use amortised costs to show the daily effective rate instead of large upfront payments.
Sharing and Maintaining Dashboards
After setting up your dashboards, the next step is keeping them relevant and accessible. Sharing, exporting, and automating dashboards ensures they remain useful across your organisation. AWS Cost Explorer provides several tools to share insights and export data, making it easier to keep everyone informed.
Sharing Dashboards Within Your Account
You can share dashboards with accounts both inside and outside your AWS Organisation, helping to standardise cost tracking and reporting across teams. When you share a dashboard, the widget configurations and layouts are included.
For convenience, pin dashboards for quick access. Additionally, you can schedule automated email deliveries of dashboard reports in PDF format on a daily, weekly, or monthly basis. As Nawaz Dhandala aptly remarks:
"A dashboard is only useful if someone is looking at it".
Automated delivery ensures that cost visibility stays top of mind for your team.
If you prefer offline analysis or need to share data outside the AWS platform, dashboards can also be exported.
Exporting Data for Reporting
Dashboards or individual widgets can be exported as PDFs, while data can be exported in CSV format for more detailed analysis. This flexibility makes it easier to integrate dashboard insights into broader reporting processes.
For organisations that depend on automated workflows, the Cost Explorer API offers even more advanced capabilities.
Using the Cost Explorer API
The Cost Explorer API allows you to retrieve dashboard data programmatically, making it easy to integrate with custom workflows or internal reporting tools. Just as you can customise widgets for specific insights, you can tailor API calls to suit your reporting needs. For example, you can automate report generation using AWS Lambda with EventBridge triggers. Keep in mind that each paginated API request costs £0.01.
This approach is especially handy for building FinOps pipelines that break down cost data by specific dimensions, such as "Environment" tags or individual services.
To prevent unnecessary overspending, it’s crucial to review dashboards regularly. As Nawaz Dhandala advises:
"Review weekly, not monthly. By the time a monthly review catches a problem, you have already overspent by thousands".
Frequent reviews and updates ensure your dashboards remain accurate and aligned with your organisation’s changing needs. Regular maintenance is key to keeping your cost insights actionable and reliable.
Conclusion
Custom dashboards offer a practical way for SMBs to keep AWS spending under control. By consolidating cost and usage metrics onto a single page, they make it easier to identify spending patterns and connections that might not be obvious in separate reports. With support for up to 20 widgets, you can monitor everything from daily costs to Savings Plans usage.
Automating visibility is another big win. You can schedule PDF reports for daily, weekly, or monthly delivery, keeping finance teams informed without the hassle of manual updates. As Nawaz Dhandala highlights:
"Custom Cost Explorer reports turn raw billing data into actionable intelligence".
This proactive approach to cost management helps you catch spending spikes early, avoiding surprises in your monthly budget.
Standardised reporting and detailed tagging allow you to break down costs by environment, team, or project. Even better, these custom dashboards come at no extra cost and are available in all AWS commercial Regions.
Getting started is simple - use predefined widgets for a quick setup. From there, you can fine-tune your dashboards as your cloud usage grows, ensuring you stay ahead of unexpected expenses. Pin your most important dashboards for easy access, and make it a habit to review them weekly. With the right setup, you’ll turn billing data into actionable insights that lead to smarter financial decisions.
For more tips on managing AWS costs, check out AWS Optimization Tips, Costs & Best Practices for Small and Medium sized businesses.
FAQs
What IAM permissions are required to create and share Cost Explorer dashboards?
To work with Cost Explorer dashboards in AWS, you'll need certain IAM permissions. These include:
- Dashboard management permissions:
ce:CreateDashboard,ce:UpdateDashboard, andce:ShareDashboard. These allow you to create, update, and share dashboards. - Cost data and sharing permissions:
ce:GetCostAndUsage,ce:GetDashboard, andram:CreateResourceShare. These are essential for accessing cost data and sharing resources.
Make sure your IAM policies include these permissions so you can fully utilise the features of Cost Explorer.
How can I use tags and cost categories to split costs by team or project?
To break down AWS costs by team or project, start by enabling Cost Allocation Tags in Cost Explorer. These tags can be AWS-generated or custom ones you create. Assign tags like Team or Project to your resources to categorise them effectively. Next, set up Cost Categories to organise costs based on these tags. Once that's done, you can create custom reports in Cost Explorer to analyse expenses by team or project, giving you a clearer picture of your cloud spending.
How can I automate dashboard PDFs and exports to avoid manual work?
AWS Cost Management offers a handy feature for automating the delivery of dashboard PDFs and exports via scheduled emails. You can configure these emails by selecting how often they’re sent - daily, weekly, or monthly - and specifying who should receive them. This way, stakeholders get timely updates on cost insights without the hassle of manual sharing.
Need more flexibility? You can also export individual widgets as CSV or PDF files whenever required, giving you greater control over specific data points.