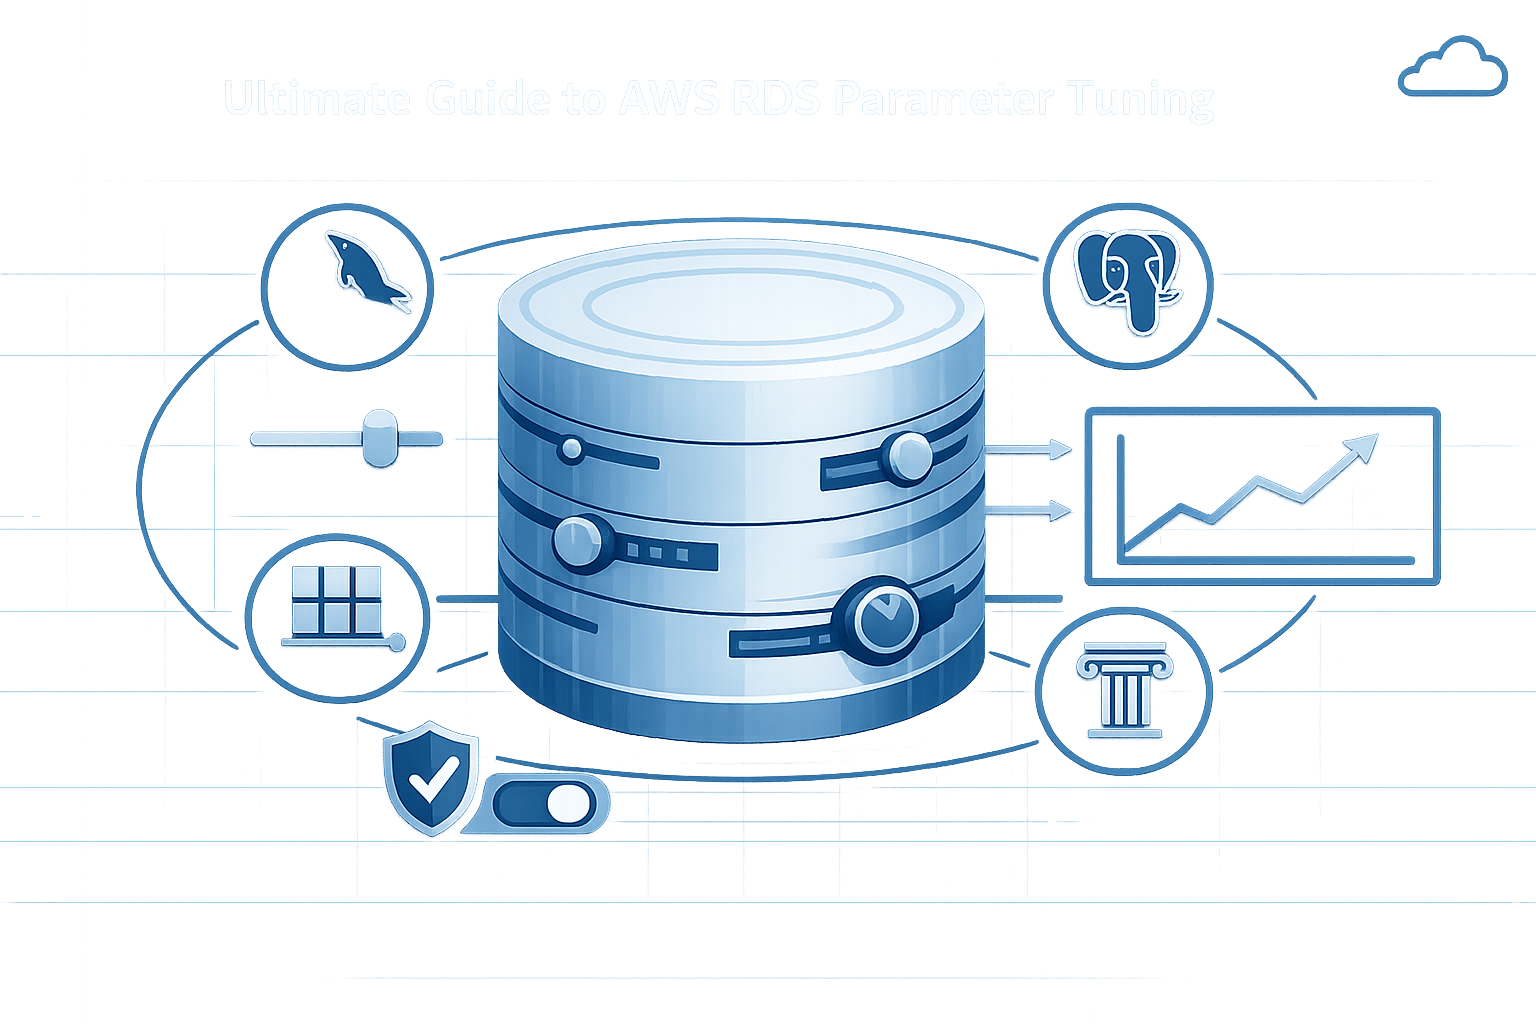
Ultimate Guide to AWS RDS Parameter Tuning
Guide to tuning AWS RDS parameter groups for MySQL, PostgreSQL, SQL Server and Oracle — create custom groups, apply changes safely and monitor with CloudWatch.
Running a database on AWS RDS is simple, but optimising its performance requires fine-tuning parameter groups. These settings control how your database engine allocates memory, handles connections, and processes queries. For small and medium-sized businesses (SMBs), adjusting parameters can improve performance, reduce costs with AWS cost optimization strategies, and prevent system instability.
Key takeaways:
- Parameter Groups: Default groups are unmodifiable; create custom groups for tailored settings.
- Dynamic vs Static Parameters: Dynamic changes apply immediately; static ones need a reboot.
- Database-Specific Tips:
- MySQL: Focus on
innodb_buffer_pool_size(~75% memory) andmax_connections. - PostgreSQL: Adjust
shared_buffers(25% memory) andwork_memfor better query performance. - SQL Server: Set
max_server_memoryto leave room for OS processes. - Oracle: Balance
sga_targetandpga_aggregate_targetfor memory efficiency.
- MySQL: Focus on
- How to Apply Changes: Use the AWS RDS console, CLI, or API. Static changes require a reboot.
- Monitoring: Use CloudWatch and Performance Insights to track metrics like memory usage, connections, and query performance.
Start by creating a performance baseline, adjust one parameter at a time, and test changes in a non-production environment. Regular monitoring ensures your database runs efficiently without unnecessary upgrades.
Optimizing Performance in AWS RDS - Best Practices and Techniques | Part 2
RDS Parameters by Database Engine
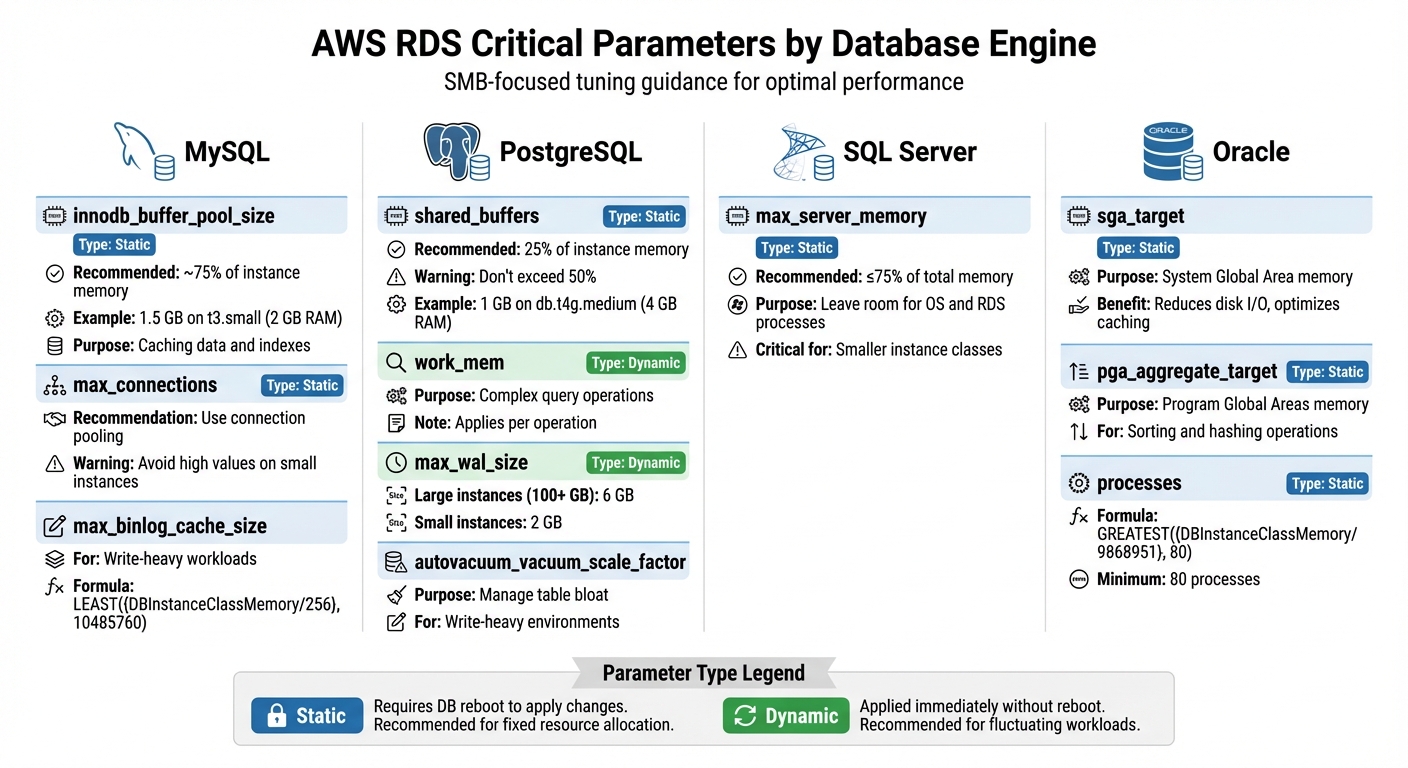
AWS RDS Parameter Tuning Guide by Database Engine
Adjusting RDS parameters for each database engine can make a world of difference, especially for small and medium-sized businesses (SMBs). The right tuning ensures your applications run smoothly without unnecessary bottlenecks. Below, we explore key parameters for specific database engines and how they can be fine-tuned for SMB workloads.
MySQL Parameters
For MySQL, innodb_buffer_pool_size is a must-focus parameter. It determines how much memory is allocated for caching data and indexes. AWS typically sets this to about 75% of {DBInstanceClassMemory}, which keeps frequently accessed data in RAM and reduces slower disk reads. For instance, on a t3.small instance (2 GB RAM), this translates to approximately 1.5 GB allocated to the buffer pool.
Another crucial parameter is max_connections, which caps the number of simultaneous database connections. While the default value scales with instance size, avoid setting it too high on smaller instances like t3.micro or t4g.micro. Excessive connections can lead to memory allocation failures, causing the instance to fail to start. Instead, use connection pooling to manage connections efficiently.
For write-heavy workloads, max_binlog_cache_size is worth attention. This parameter limits the memory a single transaction can use for binary logging. AWS uses a formula like LEAST({DBInstanceClassMemory/256}, 10485760) to prevent large transactions from hogging resources.
PostgreSQL Parameters
In PostgreSQL, shared_buffers is a key setting to adjust. This parameter governs memory allocation for shared memory buffers, and AWS recommends setting it to roughly 25% of instance memory. Going beyond 50% can trigger errors like "FATAL: could not map anonymous shared memory". For example, on a db.t4g.medium instance with 4 GB RAM, 1 GB is a practical target.
work_mem, a dynamic parameter, controls memory for internal operations like sorting and hash tables. Increasing it can speed up complex queries, but since it applies per operation, be cautious about overall memory usage during concurrent queries.
For write-intensive environments, max_wal_size is another important parameter. It sets the cap for Write-Ahead Logging (WAL) data before triggering a checkpoint. On PostgreSQL 16 or later, AWS automatically configures this to 6 GB for instances with 100 GB or more storage, and 2 GB for smaller instances. A higher value reduces checkpoint frequency, improving write performance, though it can extend recovery times after crashes.
Finally, autovacuum_vacuum_scale_factor and autovacuum_analyze_scale_factor are vital for managing table bloat in write-heavy environments. Proper tuning ensures autovacuum runs often enough to maintain performance without overwhelming I/O.
SQL Server Parameters
SQL Server offers fewer configurable parameters, but max_server_memory is essential. This static setting limits the memory SQL Server can use, ensuring there’s enough left for the operating system and RDS management processes. This is particularly important for SMBs using smaller instance classes.
Oracle Parameters
For Oracle databases, sga_target is the main parameter to tweak. It controls memory allocation for the System Global Area (SGA), which includes the buffer cache and shared pool. Proper adjustment reduces disk I/O and optimises caching.
pga_aggregate_target is another key parameter, managing memory for Program Global Areas (PGA), which handle operations like sorting and hashing. Balancing sga_target and pga_aggregate_target is crucial to avoid memory shortages.
Lastly, the processes parameter sets the maximum number of concurrent processes, including user sessions and background tasks. AWS uses a formula like GREATEST({DBInstanceClassMemory/9868951}, 80) to ensure at least 80 processes are available even on smaller instances.
| Database Engine | Critical Parameter | Type | SMB Tuning Guidance |
|---|---|---|---|
| MySQL | innodb_buffer_pool_size |
Static | Allocate ~75% of {DBInstanceClassMemory} for caching data and indexes. |
| MySQL | max_connections |
Static | Use connection pooling; avoid high values on small instances to prevent memory errors. |
| PostgreSQL | shared_buffers |
Static | Set to 25% of instance memory; avoid exceeding 50% to prevent startup errors. |
| PostgreSQL | work_mem |
Dynamic | Increase for complex queries; monitor memory usage during concurrent operations. |
| PostgreSQL | max_wal_size |
Dynamic | Set to 6 GB for large storage instances; 2 GB for smaller ones. |
| SQL Server | max_server_memory |
Static | Limit SQL Server memory to leave room for the OS and RDS processes. |
| Oracle | sga_target |
Static | Adjust to optimise caching and reduce disk I/O. |
| Oracle | processes |
Static | Use the GREATEST formula to ensure at least 80 processes on smaller instances. |
With these tailored settings, you can fine-tune RDS parameter groups to meet the demands of your workload effectively.
How to Configure and Apply RDS Parameter Groups
Creating and Editing Parameter Groups
Default parameter groups in RDS are locked from changes, so if you need to adjust engine configuration values, you’ll need to create a custom parameter group. Head to the Parameter Groups section in the RDS console, and create a new group by specifying the database engine family, group name, and description. Make sure the parameter group family matches the database engine and version of your instance. If you're only tweaking a few settings from an existing custom group, the "Copy" function can save time by duplicating the group instead of starting from scratch.
Once your custom group is ready, open it, click Edit, and adjust the required parameters. Many parameters, especially integers and Booleans, allow expressions or calculations instead of fixed values. Before making changes, back up your data - incorrect configurations can lead to performance issues or even system instability. For parameters like character set and collation, set these before creating the database.
Finally, apply the custom parameter group to your RDS instance.
Applying Parameter Groups to RDS Instances
When you associate a new parameter group with an RDS instance, dynamic parameters take effect immediately, but static parameters will require a reboot. To apply the new group, navigate to Databases in the RDS console, select the instance, click Modify, find the DB parameter group option, and choose your custom group. You’ll then have the option to apply changes immediately or during the next maintenance window. For RDS for SQL Server Multi-AZ setups (AlwaysOn/Mirroring), note that a failover will occur when the instance reboots after associating the new parameter group.
Dynamic parameters are applied right away, but static ones need a manual reboot to take effect. When associating a parameter group for the first time, all parameters - dynamic or static - require a reboot. If you're using the AWS CLI or RDS API, set the ApplyMethod to pending-reboot for dynamic parameters if you want to delay the changes until a manual reboot. For RDS for SQL Server, use apply-immediately for dynamic parameters, as choosing pending-reboot will result in an error.
Validating Changes
To ensure your changes are active, check the Configuration tab in the RDS console for your instance. If the status says in-sync, the instance is using the latest version of the parameter group. If it shows pending-reboot, you’ll need to manually reboot the instance to apply the changes. Keep in mind, this status won’t trigger a reboot during the next maintenance window. For Aurora clusters, you can use the AWS CLI with the command aws rds describe-db-clusters --db-cluster-identifier [identifier] to verify the DBClusterParameterGroupStatus.
| Parameter Type | Application Method | Console Status if Not Applied | Action Required |
|---|---|---|---|
| Dynamic | Immediate (default) | in-sync | None |
| Static | After Reboot | pending-reboot | Manual Reboot |
| New Group Association | After Reboot | pending-reboot | Manual Reboot |
After confirming that the parameter changes are applied, test them in a non-production environment first. Misconfigured parameters can lead to performance degradation or system instability. Additionally, if an instance using a custom parameter group is stopped, RDS will automatically reboot it when started to apply the changes.
Best Practices for Tuning RDS Parameters
Memory and Storage Optimisations
To keep your database running smoothly, it's crucial to ensure that your working set fits within the available RAM. This helps serve queries directly from memory, cutting down on slower disk reads. Keep an eye on metrics like ReadIOPS to decide if your instance might need scaling.
When it comes to memory allocation, follow the guidelines for your specific database engine:
- MySQL: Allocate about 50% of total memory to
innodb_buffer_pool_size. - PostgreSQL: Dedicate 25% of memory to
shared_buffers. - SQL Server: Set
max server memoryto use no more than 75% of total memory.
If you notice CPU, memory, or storage usage consistently hitting over 75%, it might be time to reassess your workload or upgrade your instance.
For storage, always leave some breathing room to handle unexpected demand. Plan to upgrade before usage hits 85% capacity. If your workload outpaces the I/O capacity of your current storage, consider switching to General Purpose SSD or Provisioned IOPS SSD instead of magnetic storage. While RDS supports up to 64 TiB of storage, remember that MySQL and MariaDB table files are capped at 16 TiB each.
Connection Limits and Scaling
Managing database connections is just as important as optimising memory. The max_connections parameter determines how many sessions can run simultaneously, but increasing this value isn’t always the best solution.
Before making changes, focus on optimising your most resource-heavy queries. Often, this alone is enough to reduce the load on CPU and memory, allowing your current setup to handle more connections. To establish a solid baseline, track average, maximum, and minimum connection levels during both peak and off-peak times. For read-heavy applications, setting up read replicas can help distribute traffic without overloading the primary instance.
Workload-Specific Adjustments
Fine-tuning parameters based on your workload type can make a big difference. Here are some tailored recommendations:
- OLTP workloads: Set
max degree of parallelismto 1 for better performance. - OLAP workloads: Match
max degree of parallelismto the number of cores per NUMA node, typically between 4 and 8.
For write-heavy workloads, consider:
- Increasing
innodb_log_file_sizeto 256 MB for MySQL. - Raising
wal_buffersto 16 MB for PostgreSQL to handle bursts of write activity.
If your database handles complex ad hoc queries, adjust PostgreSQL's work_mem to 16–64 MB to enable more in-memory sorting, reducing disk usage. Applications with a large number of tables may benefit from increasing table_open_cache and table_definition_cache. However, try to keep the total number of tables across all databases in an instance below 10,000, as exceeding this can lead to performance issues due to the overhead of managing open and closed storage files.
These adjustments provide a solid starting point. Regular monitoring and testing are key to refining your database's performance over time.
Monitoring and Testing Parameter Changes
Using CloudWatch Metrics
Amazon CloudWatch gathers over 50 RDS metrics every minute, providing near-instant feedback on how parameter changes affect your database. To start, establish a baseline by recording average, maximum, and minimum values during both peak and off-peak times. This baseline acts as a reference point, helping you spot unusual behaviour after implementing changes.
For memory-related parameters, such as buffer pool sizes, keep an eye on FreeableMemory and SwapUsage to ensure the operating system isn't running low on RAM. When adjusting connection limits, track DatabaseConnections to confirm your database can handle the scaling requirements of your application without performance issues.
Set up CloudWatch alarms for critical thresholds. For example, if CPU or memory usage consistently exceeds 75%, it’s a signal to investigate. These alarms can be configured to send notifications via SNS, alerting you to resource strain caused by parameter changes. Customised dashboards are another useful tool - they let you monitor key performance indicators (KPIs) at a glance, helping you detect problems faster. Note that some metrics, like CPU credits for burstable instances (e.g., db.t2, db.t3, db.t4g), are only available in five-minute intervals rather than the usual one-minute granularity.
While resource metrics are crucial, diving deeper into individual query performance can further refine your database tuning.
Query Performance Analysis
CloudWatch focuses on resource-level metrics, but for insights into how parameter changes impact specific queries, Performance Insights is your go-to tool. It provides a clear view of database load, highlights top SQL queries, and pinpoints delays caused by locking, I/O, or other bottlenecks.
Enable CloudWatch Logs to capture slow and error-prone queries, and use database utilities like EXPLAIN for deeper analysis. Enhanced Monitoring is another valuable feature, offering OS-level metrics with up to one-second granularity. This level of detail can reveal disk I/O or memory issues that standard CloudWatch metrics might overlook.
Iterative Testing and Tuning
The data gathered from metrics and query analysis will guide your next steps in parameter tuning. Adjust one parameter at a time to isolate its effects clearly. This approach ensures you can directly link any performance changes - positive or negative - to a specific adjustment.
Keep in mind that some parameters, especially those affecting caches, may need a "warmup period" before their full impact is reflected in the metrics. For instance, after modifying memory parameters, check whether ReadIOPS decreases significantly. If it doesn’t, your working set might already be fully loaded in memory. Before making any changes, back up your current parameter groups to avoid losing configurations. Remember, static parameters require a manual reboot to take effect, whereas dynamic parameters apply immediately. Plan these changes carefully to minimise disruptions.
Conclusion
Key Points for SMBs
Fine-tuning your RDS setup is all about making small, deliberate changes that lead to noticeable improvements. Adjust one parameter at a time so you can clearly measure its effect on performance. Use scalable configuration strategies to handle instance upgrades effectively, and focus on optimising resource-heavy queries to delay the need for costly upgrades.
Keep a close eye on CPU, memory, and storage usage. If these consistently exceed 75%–85%, it’s time to either tweak the configuration or consider upgrading your instance. Setting up CloudWatch alarms for metrics like FreeableMemory, CPUUtilization, and FreeStorageSpace ensures you’re notified before hitting critical capacity limits. For MySQL and MariaDB, aim to keep the total number of tables below 10,000, as exceeding this can slow down startup times and file operations.
These strategies provide a strong foundation for improving your RDS performance.
Next Steps
Start by creating a clear performance baseline. Track key metrics over specific intervals to understand your system’s behaviour and identify areas for improvement. Pay attention to the ReadIOPS metric - it’s a good indicator of whether your instance has enough RAM. If scaling up memory results in a significant drop in ReadIOPS, it’s a sign that your previous working set didn’t fit in memory.
For more tips on AWS cost management, cloud architecture, and performance strategies tailored for SMBs, check out AWS Optimization Tips, Costs & Best Practices for Small and Medium sized businesses. Additionally, set your DNS Time-to-Live (TTL) to under 30 seconds to ensure fast application reconnections after database failovers. Regularly update your database engine versions to benefit from improved performance and the latest security updates.
FAQs
How can I identify the right RDS parameters to optimise performance for my workload?
To fine-tune your RDS instance, start by evaluating your workload's unique requirements. Look closely at things like query patterns, connection volumes, and memory usage. Pay attention to settings that directly influence performance, such as max_connections, shared_buffers, or innodb_buffer_pool_size, depending on whether you're using PostgreSQL, MySQL, or SQL Server.
You can use tools like the AWS Management Console or database-specific commands (e.g., pg_settings for PostgreSQL) to examine your current configurations and performance metrics. Make adjustments gradually, testing the impact of each change to ensure it enhances performance without introducing new problems. Stick to best practices recommended for your specific database engine, and consider AWS's advice for small to medium-sized businesses to strike the right balance between performance and cost.
What problems can arise from misconfiguring RDS parameter groups?
Misconfiguring RDS parameter groups can lead to sluggish database performance, system instability, or even unexpected downtime. For instance, if static parameters are set incorrectly, a reboot might be needed for changes to take effect, which could disrupt operations. Similarly, mismanaging settings like max_connections or shared_buffers can cause resource conflicts, slow performance, or even system failures.
To minimise these risks, always plan parameter changes thoroughly and test them in a staging environment before rolling them out to production. This approach helps you catch potential issues early and ensures your database runs smoothly and reliably.
How can I track the effects of parameter changes on my RDS performance?
To understand how changes to parameters impact your RDS performance, leverage AWS monitoring tools like Amazon CloudWatch, Performance Insights, and Enhanced Monitoring. These tools provide visibility into critical metrics, including CPU utilisation, memory usage, and query performance. By keeping an eye on these, you can quickly spot any irregularities or gains.
Pay attention to the metrics that matter most for your specific workload. Compare the performance data from before and after you make adjustments. This approach lets you refine your parameters with precision, ensuring your database continues to run efficiently.