How to Set Key AWS Monitoring Metrics
Learn essential AWS monitoring strategies for SMBs to optimise performance, control costs, and maintain system health effectively.
Monitoring AWS is critical for small and medium-sized businesses (SMBs) to maintain performance, control costs, and ensure system health. Here's what you need to know:
Key Takeaways:
- Performance Monitoring: Use AWS CloudWatch to track CPU usage, execution times, and resource responsiveness.
- Cost Management: Monitor spending with AWS Cost Explorer and set daily alerts via AWS Budgets.
- System Health: Focus on API latency, error rates, and database performance to avoid downtime.
Quick Steps:
- Track Core Metrics: Use built-in CloudWatch metrics like CPU utilisation and network throughput for EC2. Configure the CloudWatch Agent for advanced metrics like memory usage.
- Custom Metrics: Use the PutMetricData API or CloudWatch Agent to monitor application response times, transaction success rates, and more.
- Set Alerts: Define thresholds for key metrics and automate responses to issues with AWS tools like Lambda and Systems Manager.
- Optimise Costs: Avoid high CloudWatch costs by using 5-minute intervals for less critical metrics and filtering logs.
- Dashboards: Create dashboards with clear visuals for system health, application performance, and costs.
AWS monitoring ensures your resources align with your business needs while preventing disruptions and overspending. Start small with basic metrics and expand as your infrastructure grows.
Monitoring AWS Resources with CloudWatch Logs, Alarms ...
Core AWS Metrics Overview
Understanding AWS metrics is key to keeping cloud performance on track while managing costs wisely. Let’s break down the essential metrics every SMB should keep an eye on.
Built-in CloudWatch Metrics
AWS CloudWatch comes with automatic tracking for several key metrics. For EC2 instances, it monitors CPU utilisation, network throughput (NetworkIn and NetworkOut), and disk I/O operations. For example, if CPU utilisation regularly exceeds 80%, it's a sign to scale up your resources to prevent performance issues.
However, some metrics, like memory usage, aren’t available by default. To access these, you’ll need to configure the CloudWatch Agent.
CloudWatch also allows you to go beyond the basics by creating custom metrics tailored to your specific business needs.
Creating Custom Metrics
Custom metrics let you track indicators that are unique to your operations. Here’s how you can set them up effectively:
Using the CloudWatch Agent
The CloudWatch Agent helps you gather detailed system-level data, such as:
- Memory usage per process
- Custom application logs
- Detailed network stats
- Disk space usage by folder or directory
Via the PutMetricData API
For application-specific insights, the PutMetricData API allows you to track:
- User engagement trends
- Transaction processing times
- Success rates for key business operations
- Performance indicators specific to your applications
For instance, you could set up a custom metric to monitor API response times. Flag responses exceeding 200 ms to catch performance issues before they affect users.
Tips for Effective Custom Metrics
- Use clear, descriptive names that make it obvious what’s being measured.
- Select the right units for measurement (e.g., percentage, milliseconds, or count).
- Add dimensions to segment data (e.g., by service, environment, or customer).
- Group multiple metrics into batches to minimise API calls and reduce overhead.
Setting Up Basic AWS Monitoring
Start by focusing on key metrics to keep track of compute performance effectively.
EC2 and Lambda Performance Tracking
Use CloudWatch to monitor EC2 instances and Lambda functions with one-minute interval updates.
- Enhanced Monitoring for EC2: Install the CloudWatch agent on your EC2 instances. This helps capture metrics like memory usage, disk I/O, and network activity.
- Lambda Monitoring: Keep an eye on critical metrics for Lambda functions, such as:
- Execution time (Duration)
- Memory usage
- Error rates
- Concurrent executions
AWS Cost Tracking
Keeping costs under control is just as important as monitoring performance. Use AWS Cost Explorer to analyse spending patterns and create a custom CloudWatch dashboard to track high-cost services. Set up daily cost alerts through AWS Budgets to avoid surprises.
System Health Monitoring
Monitoring system health ensures reliability and prevents unexpected downtime. Focus on the following areas:
-
API Gateway Metrics:
- Response latency (ideally under 200ms)
- Error rates (aim to keep these below 1%)
- Request count trends
-
Database Performance:
- Monitor connection counts
- Track query execution times
- Check available storage
- Review read/write IOPS for databases like RDS or DynamoDB
To streamline this, create a CloudWatch dashboard that shows:
- Service availability
- Error rates
- Performance metrics
- Resource usage
These steps help small and medium-sized businesses maintain AWS reliability while managing costs effectively.
Creating CloudWatch Alert Rules
Set up CloudWatch alert rules to keep track of performance metrics and get notified when they fall outside expected ranges.
Setting Alert Thresholds
Define thresholds that reflect your application's normal performance. Here's how to approach it:
- Monitor key metrics like CPU usage, memory consumption, error rates, and response times.
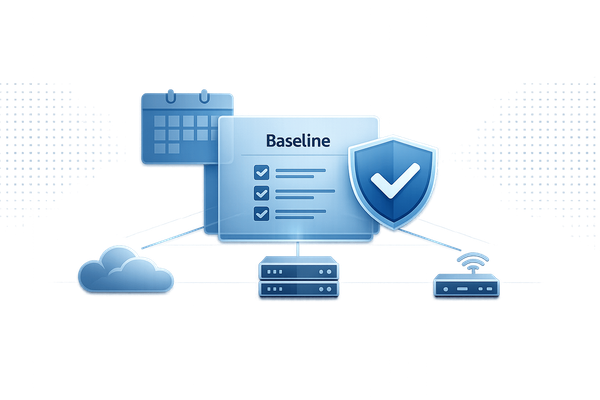
- Establish a baseline by observing your system's behaviour over a representative timeframe.
- Set separate warning and critical thresholds to differentiate between minor issues and urgent problems, reducing unnecessary alerts.
These thresholds will serve as triggers for automated responses, as detailed below.
Automating Alert Responses
Automating responses ensures quick action when issues arise. Here’s how you can handle different scenarios:
Managing Instances
- Use auto-scaling groups to adjust capacity when utilisation exceeds your thresholds.
- Enable automatic instance recovery for system status failures.
- Use AWS Lambda to automate tasks like shutting down non-production instances during off-hours.
Database and Storage Management
- Automate actions like creating database snapshots or scaling read replicas when performance metrics breach limits.
- Set up backup verification processes to ensure data remains intact.
Optimising Costs and Resources
- Use Lambda functions to identify and terminate unused elastic IPs.
- Automate cleanup of unattached storage volumes.
- Apply automated tagging policies for better resource tracking and cost control.
For more complex workflows, AWS Systems Manager can coordinate multi-step processes:
- Immediate Action: Perform scaling or failover tasks as a first response.
- Validation: Check if the automated action resolved the issue.
- Escalation: Alert on-call engineers if further intervention is needed.
AWS Monitoring Tips for SMBs
Monitoring your AWS environment doesn't have to be complicated or expensive. Here's how to create a straightforward and effective strategy.
Choosing the Right Metrics
Focus on metrics that directly impact your business goals. These can be grouped into three main categories:
Performance Metrics
- Application response times
- Error rates
- Database query speeds
- API endpoint availability
Cost Metrics
- Resource usage rates
- Hours of unused instances
- Storage growth trends
- Data transfer volumes
Customer Experience Metrics
- Duration of user sessions
- Transaction success rates
- Service response times by region
- Metrics reflecting business impact
Keeping Monitoring Costs Under Control
AWS CloudWatch costs can rise quickly if left unchecked. Here are a few ways to manage them:
Metric Resolution
- Use 5-minute intervals for less critical metrics
- Enable detailed monitoring only for production-critical resources
- Store older metrics in S3 for long-term analysis
Data Collection Efficiency
- Filter logs before sending them to CloudWatch
- Use metric math to gain more insights without collecting extra data
- Group similar metrics to avoid redundancy
Once costs are under control, focus on presenting data effectively through dashboards.
Creating Effective Dashboards
Dashboards should offer a clear view of system performance. Here's how to set them up:
Organising the Layout
- Place critical metrics at the top
- Group related metrics together
- Use consistent time ranges and clear titles
Using Visual Elements
- Line graphs for trends over time
- Gauges for usage metrics
- Heat maps to spot patterns
- Status indicators for quick checks
| Dashboard Section | Key Metrics |
|---|---|
| System Health | CPU, Memory, Disk Usage |
| Application Performance | Response Time, Error Rate |
| Cost Overview | Daily Spend, Resource Usage |
| Customer Impact | User Sessions, Transaction Success |
Making Dashboards Actionable
- Add annotations for important events
- Show threshold indicators for key metrics
- Link to runbooks for troubleshooting
- Highlight current values alongside trends
For more detailed advice on AWS cost management and monitoring, check out AWS Optimization Tips, Costs & Best Practices for Small and Medium-Sized Businesses.
Conclusion: Monitoring for AWS Success
Keeping a close eye on your AWS setup helps prevent problems and manage costs effectively for small and medium-sized businesses (SMBs). By following the strategies shared earlier, you can set your business up for success with AWS.
Key Points to Remember:
Here are three essential aspects to focus on for smooth operations:
- Visibility: Tools like CloudWatch provide real-time insights into your systems.
- Cost Management: Monitoring usage helps you avoid unexpected expenses.
- Business Focus: Ensure metrics align with your business goals.
Start by tracking basic metrics and expand as your AWS environment grows. Regularly review and tweak your monitoring approach to keep up with changes in your infrastructure. CloudWatch metrics can help you spot issues faster, manage costs more effectively, and ensure your resources are aligned with what your business needs.
For more in-depth advice on AWS cost management and monitoring, check out AWS Optimization Tips, Costs & Best Practices for Small and Medium-Sized Businesses. It’s a great resource for getting the most out of your AWS investment.
FAQs
How can small and medium-sized businesses monitor performance and costs effectively using AWS CloudWatch?
AWS CloudWatch is a powerful tool for SMBs to track both performance and costs. To get started, identify the key metrics that matter most to your business, such as CPU utilisation, memory usage, disk I/O, and network traffic. These metrics help you monitor application performance and ensure your systems are running efficiently.
For cost monitoring, enable billing alarms in CloudWatch to track expenses in real-time. Set thresholds in GBP (£) to receive alerts when costs approach your budget. This allows you to take proactive steps to optimise usage and avoid unexpected charges.
By combining performance and cost monitoring, SMBs can maintain a well-optimised AWS environment. For more tips on AWS optimisation, costs, and best practices for SMBs, explore resources tailored to businesses like yours.
What are the best practices for creating custom metrics in AWS CloudWatch to meet your business goals?
To create custom metrics in AWS CloudWatch that align with your business objectives, start by identifying the key performance indicators (KPIs) that are most relevant to your operations. These could include metrics related to application performance, resource utilisation, or customer experience.
When setting up custom metrics, ensure they are specific, actionable, and aligned with your business goals. Use descriptive names and tags to organise metrics effectively, making them easier to analyse. Additionally, configure alarms and dashboards in CloudWatch to monitor these metrics in real time, enabling proactive responses to potential issues.
For small and medium-sized businesses, focusing on cost efficiency and scalability is crucial. Regularly review your metrics to ensure they remain relevant as your business evolves. For more insights on optimising AWS usage, including cost-saving tips and best practices tailored for SMBs, refer to expert resources such as AWS for SMBs.
How can AWS users automate alerts to reduce downtime and keep systems running smoothly?
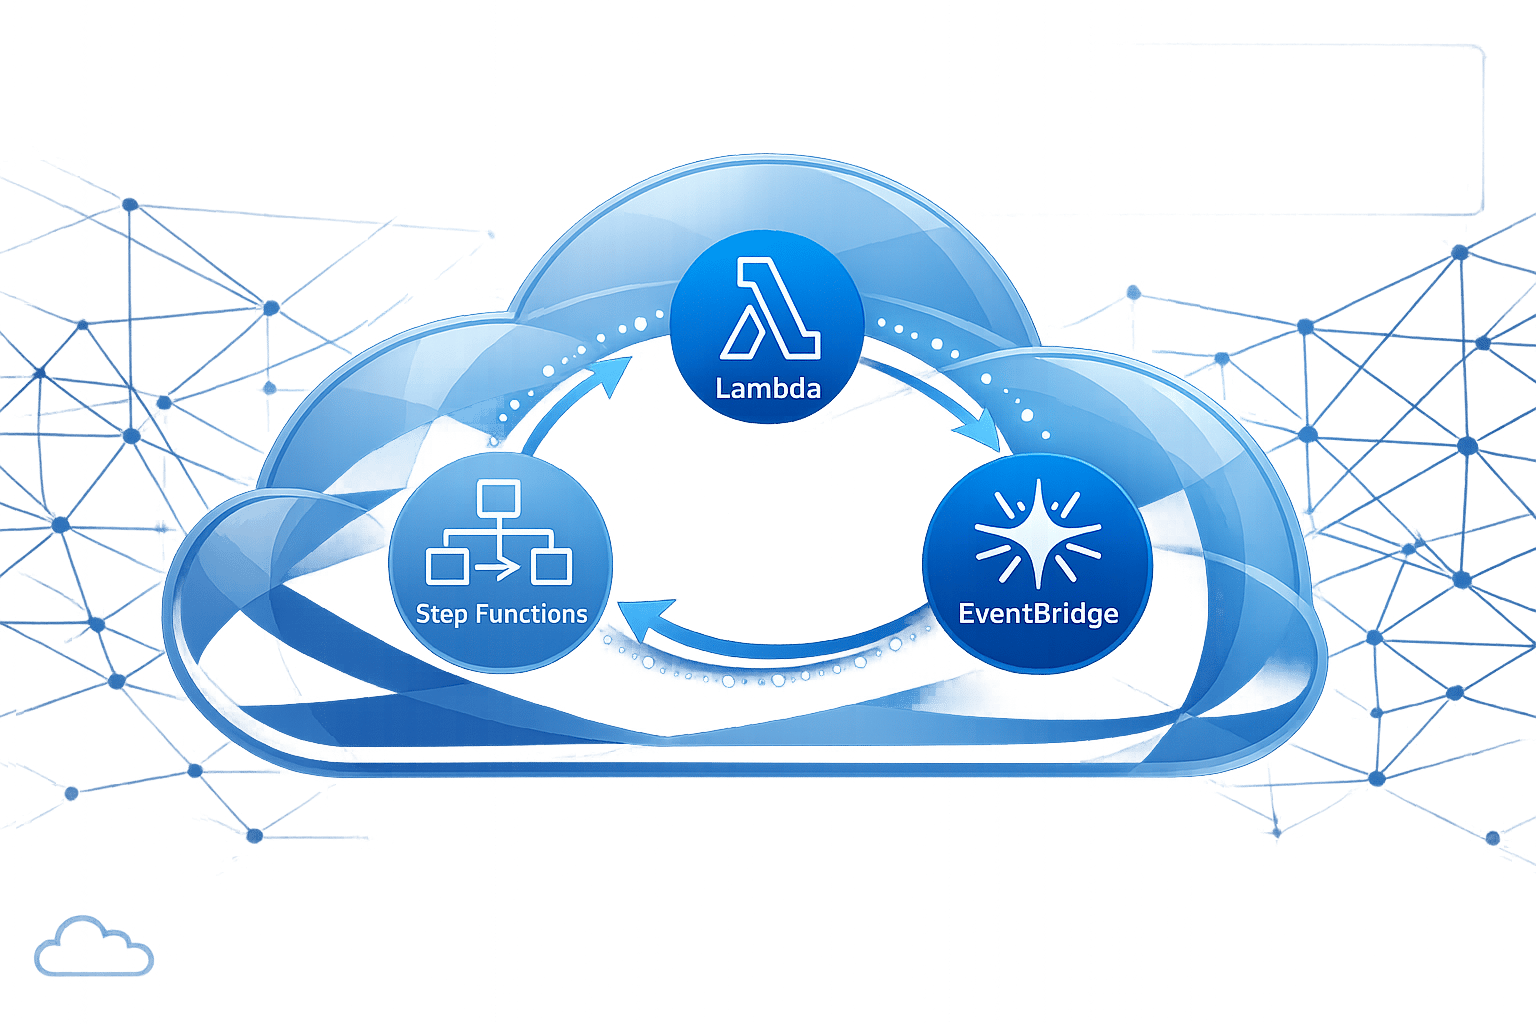
AWS users can automate responses to alert thresholds using Amazon CloudWatch Alarms and AWS Lambda. CloudWatch allows you to monitor key metrics and set alarms for specific thresholds, such as CPU usage or memory levels. When an alarm is triggered, you can configure it to automatically invoke a Lambda function, which can perform actions like restarting instances, scaling resources, or notifying your team via email or SMS.
To set this up, define your metrics in CloudWatch, create an alarm with appropriate thresholds, and link it to a Lambda function that executes the required response. This approach helps minimise downtime and ensures your systems remain healthy without manual intervention.