Common RDS Performance Issues and Solutions
Explore common RDS performance issues like slow queries and high CPU usage, along with effective solutions to optimise your database performance.
Struggling with slow database performance on Amazon RDS? Here’s a quick summary of the most common problems and how to fix them:
- Slow Queries: Caused by poor query optimisation or missing indexes. Solution: Add composite indexes and optimise queries to reduce latency by up to 68%.
- High CPU Usage: Often due to unoptimised queries or undersized instances. Solution: Monitor CPU with Amazon CloudWatch and adjust instance sizes.
- Storage Bottlenecks: Issues like exceeding provisioned IOPS or high latency. Solution: Use io2 Block Express for faster I/O and enable storage autoscaling.
- Memory Limitations: Can lead to increased disk I/O. Solution: Fine-tune memory settings based on your instance’s RAM.
Key Tools for Monitoring:
- Amazon CloudWatch: Tracks CPU, I/O, memory, and connection metrics.
- RDS Performance Insights: Analyses query performance and resource usage.
To keep your database running smoothly, focus on regular maintenance, auto-scaling, and cost-effective configurations. For example, a retailer in Birmingham reduced storage costs by 22% while maintaining sub-100ms query latency through optimised storage.
Pro Tip: Always test updates in a staging environment and enable auto-scaling to handle workload spikes efficiently.
For more insights and practical tips, dive into the full guide below.
Optimizing Performance in AWS RDS - Best Practices and ...
Main RDS Performance Problems
Database performance issues can significantly impact small and medium-sized businesses (SMBs). Below, we break down the key challenges, including slow queries, CPU strain, and storage bottlenecks, and how these issues affect overall performance.
Query Speed Issues
Slow queries are often caused by poorly optimised database queries and missing indexes. These issues can lead to:
- Long Response Times: Queries that should take milliseconds end up taking seconds or even minutes.
- Connection Timeouts: Prolonged query durations can cause connections to drop.
- Resource Drain: Inefficient queries unnecessarily consume CPU and memory resources.
For instance, scanning an entire table without an index wastes resources, especially when dealing with millions of records. Inefficient queries like this not only slow things down but also put extra strain on the CPU.
CPU Usage Problems
High CPU usage is another common performance bottleneck. It can manifest as:
- Consistently High Utilisation: The CPU remains heavily taxed during peak times.
- Slower Performance: Query execution slows down as the load increases.
- Connection Failures: When resources are maxed out, new connections might be refused.
These issues often stem from unoptimised queries, undersized instances, or resource-heavy operations. Tools like Amazon CloudWatch can help monitor CPU usage and identify problems early, preventing them from affecting operations.
Storage Performance Limits
Storage bottlenecks can also hurt application performance in several ways:
- Exceeding Provisioned IOPS: Going beyond the allocated input/output operations per second.
- Higher Latency: Increased delays in data access.
- Frequent Disk Reads: Insufficient memory forces data to be read directly from disk.
Under heavy workloads, these bottlenecks can result in reduced read/write speeds, increased latency, and timeouts - particularly in transaction-heavy environments. Monitoring and proactive management are essential to keep storage performance in check.
For more tips on optimising database performance, check out AWS Optimisation Tips, Costs & Best Practices for SMBs.
RDS Performance Solutions
Memory Management
When setting up SQL Server instances, configure memory using the formula:
max_server_memory = Total_RAM - (1 GB + memory_reserved_based_on_RAM)
For example, on a 64 GB instance, reserve 11 GB (1 GB for the operating system, 4 GB for the first 16 GB, and 6 GB for the remaining 48 GB). This leaves 53 GB available for SQL Server. If you're using business intelligence tools like SSRS, reserve an additional 10% of RAM.
A SaaS startup in Manchester reported a 30% cost reduction while maintaining 99.9% uptime after fine-tuning memory settings and improving monitoring. Once memory settings are optimised, the next step is improving query performance.
Query Efficiency
Boost query performance with better indexing and optimisation techniques. Some impactful strategies include:
| Optimisation Technique | Performance Impact |
|---|---|
| Composite Indexing | 68% reduction in query latency |
| Parallel Read Threading | 2.4× faster analytics |
| Connection Pooling | 40% less memory usage |
For MySQL 8.0 and later, enable innodb_parallel_read_threads (default value: 4) in custom parameter groups. A Bristol-based e-commerce platform achieved 2.4× faster analytics queries by utilising columnar indexes.
Storage Speed Improvements
After addressing memory and query efficiency, focus on enhancing storage performance with these methods:
-
Provisioned IOPS Selection
Use io2 Block Express, which supports up to 256,000 IOPS and 4,000 MB/s throughput. For example, a logistics company in Liverpool processes 50,000 transactions per minute with io2 storage at £0.138/GB/month, achieving sub-millisecond latency. -
Workload Distribution
An NHS-affiliated health application reduced peak I/O by 55% by adopting the following strategies:- Utilising read replicas in the eu-west-2 (London) region
- Sharding data regionally
- Scheduling batch updates between 22:00 and 06:00 GMT
-
Storage Configuration
Implement these storage solutions for cost and performance efficiency:- gp3 storage: Offers 3,000 IOPS baseline at £0.095/GB/month
- RDS Storage Autoscaling: Configured with a 10% buffer
- Dedicated log volumes for SQL Server: Priced at £0.045/GB/month
For more detailed advice on optimising RDS performance for small and medium-sized businesses, visit AWS Optimisation Tips, Costs & Best Practices for SMBs.
Performance Monitoring Tools
Using Amazon CloudWatch
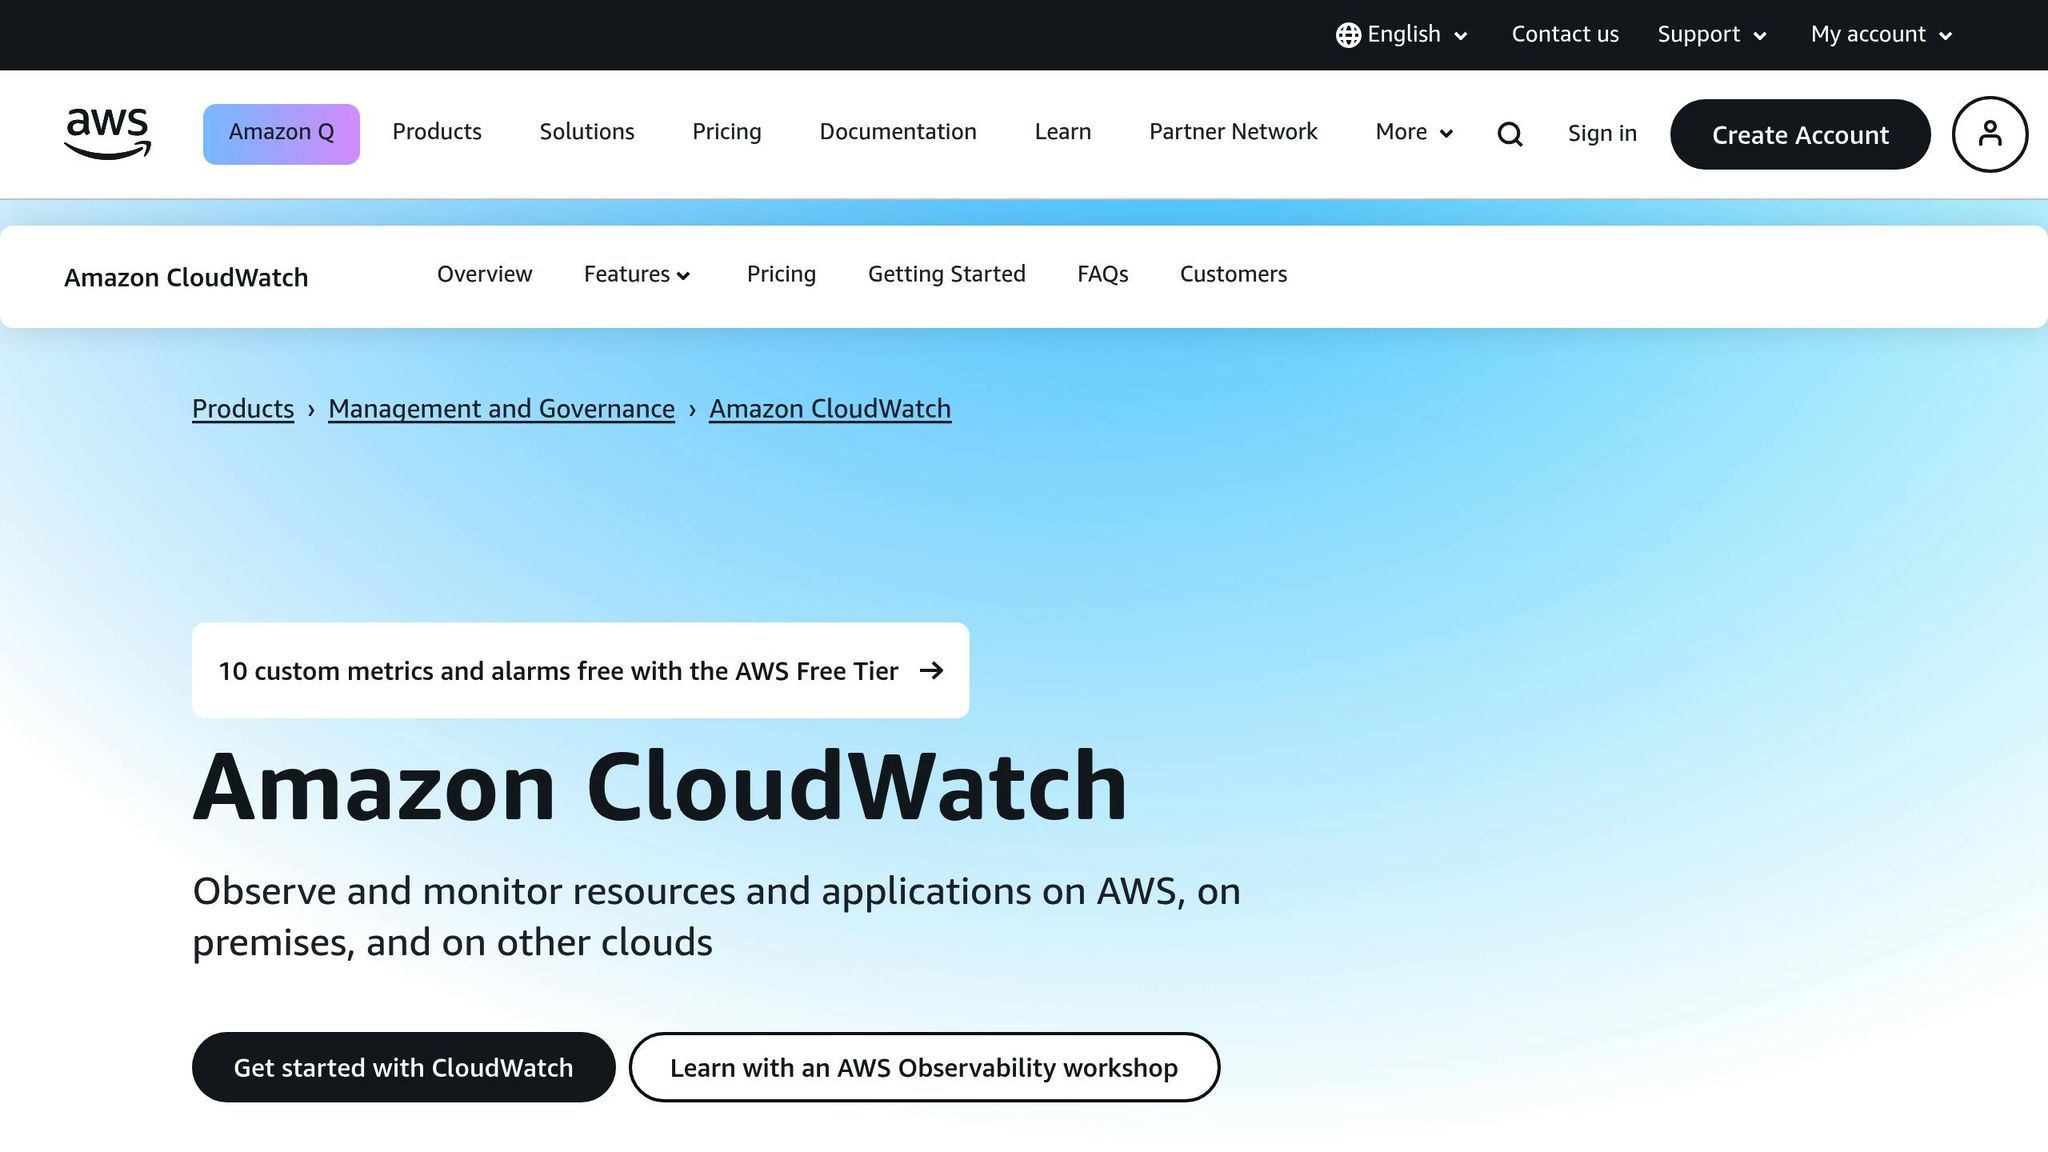
Amazon CloudWatch helps you keep an eye on key metrics like CPU usage, I/O operations, memory, and connection activity. By setting up custom alarms tailored to your specific needs, you can quickly spot and address potential performance problems. This real-time tracking also integrates well with RDS Performance Insights for further analysis.
RDS Performance Insights Guide
RDS Performance Insights provides a detailed look into your database’s activity and query performance. You can track metrics like average active sessions, resource usage, and query execution patterns. This makes it easier to pinpoint and resolve performance issues within your database setup. It works seamlessly with other monitoring tools, including those for managing read replicas.
Read Replica Monitoring
To keep your read replicas running smoothly, monitor metrics like replication lag, CPU usage, storage, network latency, and query distribution. Regularly reviewing these areas ensures consistent performance across your database system, even in distributed environments.
Long-term RDS Maintenance
Maintaining your RDS setup isn't just about quick fixes - it requires ongoing attention to ensure consistent performance over time.
Database Version Updates
Keeping your database engine up to date is crucial for maintaining performance and security. Here's how to handle updates effectively:
- Test updates in a staging environment before rolling them out to production.
- Always create full backups before making changes.
- Track key metrics before and after updates to monitor the impact.
- Enable automated minor version updates when suitable.
For major version upgrades, dedicate enough time for testing to ensure compatibility with your current applications and stored procedures.
Auto-scaling Setup
Auto-scaling helps manage resources efficiently while keeping costs under control. To set it up:
- Define clear thresholds for when scaling actions should occur.
- Add cool-down periods to avoid frequent scaling adjustments.
- Establish minimum and maximum instance sizes to maintain stability.
Balancing Costs and Performance
Here are three practical ways to strike the right balance between cost and performance:
-
Storage Management
Use storage auto-scaling to adjust capacity as needed, avoiding unnecessary over-provisioning. -
Right-sizing Instances
Periodically review your instances and adjust their size, especially during off-peak hours. For development environments, smaller burst-capable instances can save money. -
Read Replicas
Use read replicas to distribute workloads and improve performance without excessive costs.
For more tips on managing AWS costs while maintaining performance, particularly for small and medium-sized businesses, check out AWS Optimization Tips, Costs & Best Practices for Small and Medium sized businesses.
Conclusion
Improving RDS performance involves a mix of consistent monitoring, regular maintenance, and smart resource management. Tools like CloudWatch and RDS Performance Insights help small and medium-sized businesses keep their databases running smoothly while staying within budget.
Addressing common challenges requires a combination of tracking performance metrics, fine-tuning resources, and managing costs effectively. With CloudWatch and RDS Performance Insights, you can analyse query performance, adjust storage configurations, and automate scaling to meet your workload demands.
To put these ideas into practice, focus on three key areas: setting up automated alerts for monitoring, choosing the right instance sizes and storage for your needs, and managing costs to balance performance with financial goals.
Since workloads are always changing, performance optimisation should be a continuous process. For more detailed advice on applying these methods in your AWS setup, check out AWS Optimization Tips, Costs & Best Practices for Small and Medium sized businesses.
FAQs
How can I check if my Amazon RDS instance is too small for my needs, and what can I do to fix it?
To determine if your Amazon RDS instance is undersized, monitor key metrics like CPU utilisation, memory usage, disk I/O, and connection limits using Amazon CloudWatch. If these metrics consistently approach or exceed their thresholds, it’s a sign that your instance may be too small for your workload.
To address this, you can:
- Scale vertically by upgrading to a larger instance type with more CPU, memory, or storage capacity.
- Optimise queries and database configurations to reduce resource consumption.
- Enable read replicas to offload read-heavy workloads.
Regularly reviewing your database performance and workload patterns can help you avoid bottlenecks in the future. For more tips on improving RDS performance and managing AWS efficiently, explore resources tailored for small and medium-sized businesses.
What are the best practices for using Amazon CloudWatch to monitor RDS performance efficiently?
To monitor Amazon RDS performance effectively with Amazon CloudWatch, follow these best practices:
- Enable Enhanced Monitoring: This provides detailed metrics on CPU, memory, disk usage, and network throughput, helping you identify bottlenecks.
- Set Up Alarms: Configure CloudWatch alarms for critical metrics like CPU utilisation, read/write latency, and free storage space. This ensures you’re alerted promptly when thresholds are breached.
- Use Custom Dashboards: Create tailored dashboards to visualise key metrics in real-time, making it easier to spot trends and anomalies.
- Log Insights: Enable RDS Performance Insights and integrate them with CloudWatch Logs for deeper analysis of query performance and database workload.
By implementing these steps, you can proactively manage your RDS instances, optimise performance, and reduce downtime. For additional guidance on optimising AWS for small and medium-sized businesses, explore resources like Critical Cloud’s expert insights tailored for SMBs.
What are the effects of enabling storage autoscaling on Amazon RDS in terms of performance and cost management?
Enabling storage autoscaling on Amazon RDS can significantly improve performance and simplify cost management. When your database storage usage approaches its allocated limit, autoscaling automatically increases the storage capacity, preventing performance issues caused by insufficient space. This ensures consistent database performance, even during periods of unexpected growth.
From a cost perspective, autoscaling helps you avoid unnecessary upfront over-provisioning, as you only pay for the additional storage when it is needed. However, it is important to monitor usage regularly to ensure that scaling aligns with your budget and operational needs. For small and medium-sized businesses, adopting AWS best practices can further optimise costs and performance, helping you scale efficiently without overspending.