CloudWatch Alarms: Best Practices for SMBs
Learn how to effectively manage AWS resources with CloudWatch Alarms, improving incident response and controlling costs for SMBs.
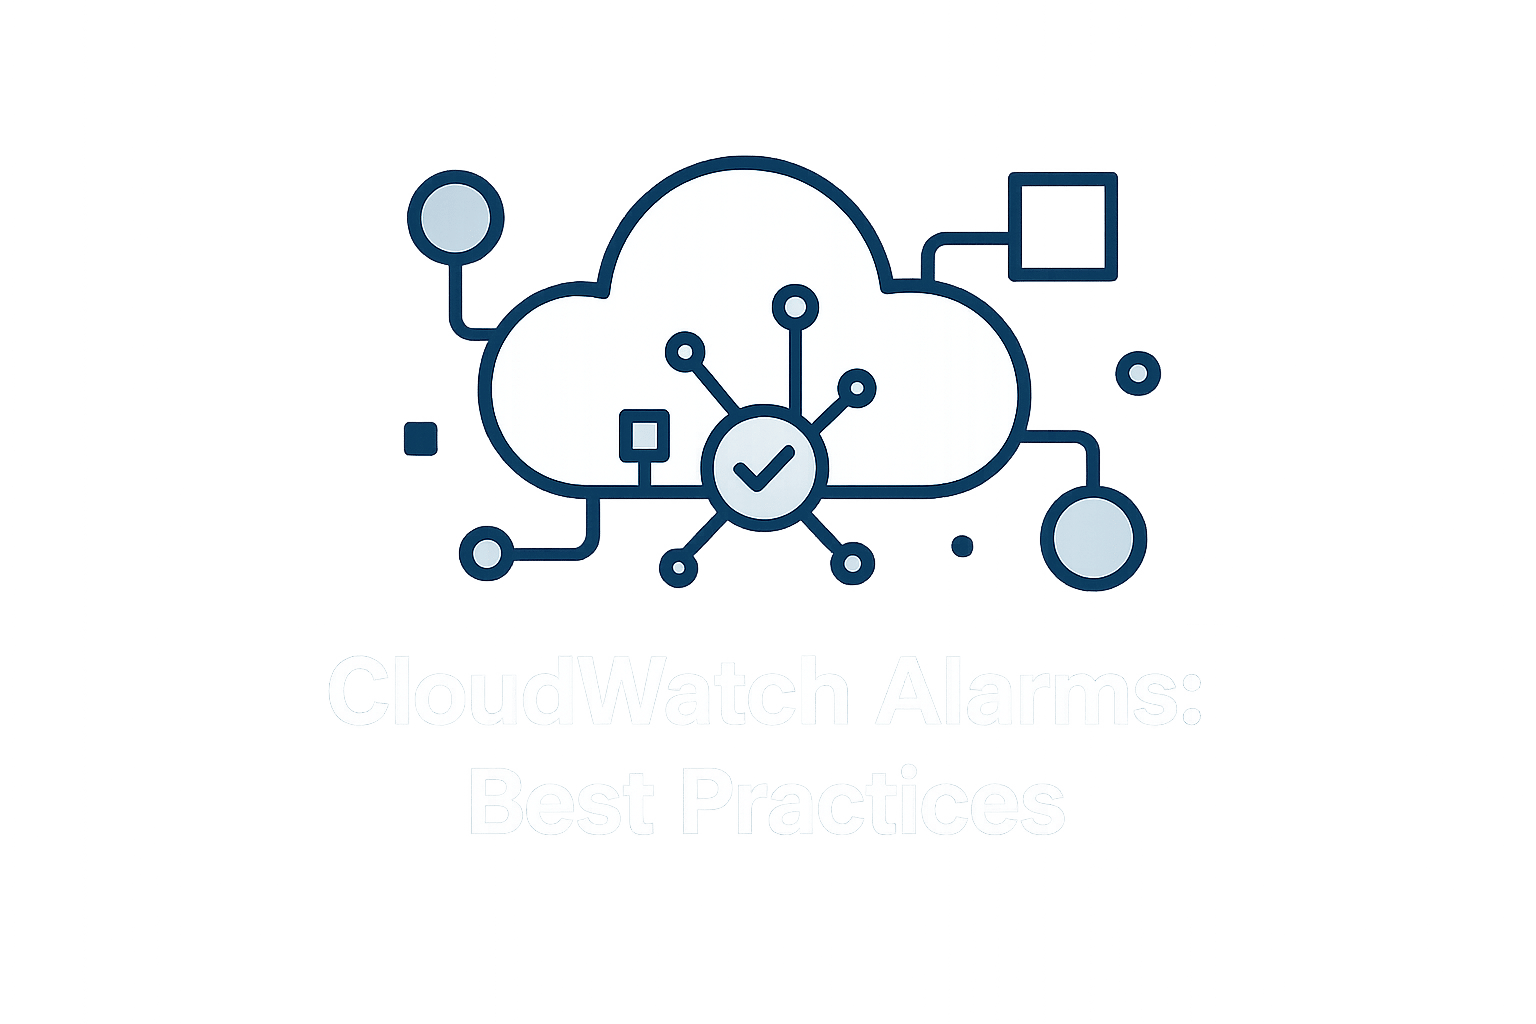
Want to keep your AWS services running smoothly without overspending? Amazon CloudWatch Alarms can help SMBs monitor key metrics, automate actions, and prevent costly disruptions. Here's what you need to know:
- What It Does: Tracks AWS resources and sends alerts when predefined thresholds are crossed (e.g., high CPU usage, low storage, or budget limits).
- Why It Matters: Improves incident response times by 89% for SMBs, helps control costs, and automates scaling during demand changes.
- How to Use It: Set alarms for critical metrics like CPU, storage, and costs. Use Composite Alarms to reduce alert noise and Anomaly Detection for dynamic thresholds.
- Free Tier: Includes 10 basic alarms per month, making it affordable to start.
Key Tip: Regularly review and adjust thresholds to match your business needs while avoiding unnecessary alerts.
For SMBs, CloudWatch Alarms provide a simple, cost-effective way to monitor and manage AWS resources effectively.
Mastering AWS CloudWatch: From Beginner to Expert in 15 ...
What Are CloudWatch Alarms?
CloudWatch Alarms keep an eye on AWS resources and metrics, triggering specific actions when set thresholds are crossed. They provide small and medium-sized businesses (SMBs) with real-time insights into their infrastructure. Grasping these fundamentals is essential for understanding their key features.
Main Alarm Features
CloudWatch Alarms operate in three states: OK, ALARM, and INSUFFICIENT_DATA. When a monitored metric crosses its defined threshold, the alarm changes state, enabling automated actions and notifications.
There are three types of alarms available:
| Alarm Type | Purpose | Best For | Evaluation Period |
|---|---|---|---|
| Metric Alarms | Monitor a single metric | Basic resource tracking | 1–5 minutes |
| Composite Alarms | Combine multiple conditions | Application stacks | 5–15 minutes |
| Anomaly Detection | Use machine learning for thresholds | Seasonal workloads | 10–60 minutes |
Anomaly detection, powered by machine learning, automatically adjusts thresholds for fluctuating workloads (like peak hours) and predicts resource issues with 92% accuracy. Composite alarms help reduce alert noise by up to 73%. These features allow SMBs to optimise performance and manage costs effectively.
SMB Use Cases
According to data, 89% of SMBs report faster incident response times with CloudWatch Alarms. Here’s how these alarms can address specific SMB needs:
Cost Control and Resource Management
- Set budget alerts to track monthly AWS spending.
- Automate shutdowns for non-production instances during off-hours.
- Identify and address idle resources to avoid unnecessary expenses.
For efficient monitoring, focus on tracking these key metrics:
- CPU usage
- Disk operations
- Network traffic (in/out)
- HTTP 5xx errors
- Healthy host count
AWS offers a free tier that includes 10 basic metric alarms per month, making it easier for SMBs to adopt monitoring solutions without overspending while scaling their infrastructure.
Setting Up CloudWatch Alarms
After learning about CloudWatch alarm features and how they fit into SMB use cases, it's time to configure your alarms effectively.
Creating Resource Alarms
Start by monitoring key AWS resources. Here are some examples:
- EC2 Instances: Keep an eye on CPU usage by setting two thresholds - one for early warnings and another for critical alerts.
- RDS Databases: Track parameters like available storage and connection counts. Set alerts for low storage or high connection usage to stay ahead of potential issues.
- Lambda Functions: Monitor error rates and execution times. Trigger alarms if errors increase or execution times approach the timeout limit.
Choose metrics that accurately reflect the performance of these resources.
Choosing Metrics
The right metrics depend on your operational needs. Common categories include:
- Performance: Metrics like CPU usage.
- Memory: Available memory levels.
- Storage: Remaining free space.
- Network: Throughput and latency.
- Cost: Spending patterns over time.
Customise thresholds based on historical data and your business priorities. After defining metrics, set up notifications to receive alerts in real time.
Setting Up Notifications
Timely notifications are crucial for quick responses. Here's how to configure them:
- Primary Notifications: Use SNS topics to categorise alerts by severity. Send standard alerts via email and critical ones via SMS.
- Escalation Process: Establish a tiered response system with escalation delays and backup contacts to ensure coverage during off-hours.
Always test your notifications during quieter periods to confirm they’re working as expected.
CloudWatch Alarm Management
Once alarms are set up, managing them effectively ensures they remain useful and cost-efficient.
Reducing Alert Noise
Avoid overwhelming your team with unnecessary alerts by fine-tuning configurations:
- Composite Alarms: Set alarms to trigger only when several key metrics (like high CPU and memory usage) are breached simultaneously.
- Anomaly Detection: Use historical data to create dynamic thresholds instead of relying on static limits.
| Alert Type | Traditional Approach | Refined Approach |
|---|---|---|
| Resource Usage | Fixed metric thresholds | Composite alarms combining multiple metrics |
| Performance | Static threshold for latency | Anomaly detection based on historical data |
| Cost | Frequent alerts from daily checks | Aggregated alerts reflecting long-term trends |
Maintaining Alarm Settings
As your infrastructure evolves, so should your alarm configurations. Regular reviews help keep your monitoring accurate:
- Threshold Adjustments: Use historical data to fine-tune thresholds for better performance tracking.
- Business Hours: Modify thresholds to account for peak (08:00–18:00 GMT) and off-peak activity.
- Document Configurations: Keep a centralised record of each alarm, including its purpose, owner, response steps, and review schedule.
Controlling Alarm Costs
Efficient alarm settings can help you manage monitoring expenses:
- Data Retention Strategy: Use a tiered approach - store high-resolution metrics short-term, medium-resolution data for intermediate periods, and aggregated data for long-term analysis.
- Metric Consolidation: Combine similar resources into a single alarm using metric math instead of creating individual alarms.
- Prioritise Critical Metrics: Monitor key application-level metrics closely, use basic monitoring for less critical resources, and reserve custom metrics for specific scenarios.
For more insights, visit AWS Optimization Tips, Costs & Best Practices for Small and Medium sized business.
Fixing Common Alarm Issues
Common Problems and Solutions
Alarm issues often stem from incorrect thresholds or integration missteps. Here's how to address some typical problems:
Missing Critical Alerts
- Ensure the metric namespace and dimensions match your resources exactly.
- Double-check notification endpoint settings, including permissions for SNS topics.
- Turn on detailed monitoring to capture data at one-minute intervals.
False Positive Alerts
- Use historical data to set dynamic thresholds.
- Apply metric math to create composite alarms that consider multiple data points.
- Set evaluation periods to at least 2-3 intervals to filter out short-term spikes.
For deeper insights, log analysis can help identify the root causes.
Using Logs for Issue Analysis
Leverage targeted metric filters to extract patterns, such as error counts or response times, to quickly diagnose issues:
| Log Pattern | Metric Filter | Use Case |
|---|---|---|
| ERROR | Count occurrences | Track application errors |
| Response time > 200ms | Average response time | Monitor performance |
| Status code 5XX | Error rate percentage | Assess service health |
These insights from logs can clarify the origins of alerts and enhance your alarm configurations.
Cross-Account Monitoring
When monitoring resources across multiple AWS accounts, ensure proper IAM roles and cross-account permissions are in place. Setting up a centralised logging account can provide better visibility.
Alarm Setup Options
Choose an alarm configuration that fits your monitoring requirements:
| Configuration Type | Best For | Limitations |
|---|---|---|
| Static Thresholds | Predictable workloads with consistent patterns | May trigger false alerts during normal variations |
| Anomaly Detection | Workloads with dynamic or seasonal patterns | Requires 2-3 weeks of historical data |
| Composite Alarms | Scenarios needing multiple conditions | More complex to configure |
Performance Optimisation Tips
- Group similar resources under a single alarm using wildcard matching.
- Use metric math to reduce the number of individual alarms.
- Set a warning threshold at 70% and a critical threshold at 90%.
Regularly review your alarm settings and adjust them as needed. AWS Systems Manager can help automate alarm setup across multiple resources, saving time and effort.
Summary
The guidelines above simplify managing CloudWatch alarms for small and medium-sized businesses (SMBs). Proper management is key to ensuring AWS infrastructure runs smoothly while keeping expenses under control. Regularly updating and reviewing configurations improves monitoring effectiveness.
Key Practices for Setup:
When setting up CloudWatch alarms, take a thoughtful approach. Focus on these practices:
- Set thresholds tailored to specific metrics.
- Use composite alarms for more advanced monitoring needs.
- Enable anomaly detection to handle dynamic workloads.
- Keep logging centralised for setups spanning multiple accounts.
Getting the Most Out of CloudWatch:
To balance performance and costs effectively:
- Group similar resources with wildcard matching.
- Use progressive thresholds for better control.
- Apply metric math to simplify monitoring across multiple metrics.
- Schedule quarterly reviews to fine-tune performance and manage costs.
Troubleshooting Tips:
For troubleshooting, consider these steps:
- Double-check metric details.
- Verify notification endpoints are set up correctly.
- Look at historical data for patterns or anomalies.
- Review logs for deeper insights.
Ensure IAM roles and cross-account permissions are correctly configured for full monitoring capabilities.
FAQs
What are the key metrics SMBs should monitor using CloudWatch Alarms to optimise performance and costs?
To identify the most critical metrics to monitor with CloudWatch Alarms, SMBs should focus on their specific business goals and operational priorities. Start by considering metrics related to cost management, such as monthly AWS spend, and performance indicators, like CPU utilisation, memory usage, and request latency.
For example, if your business relies on a web application, monitor metrics like HTTP error rates and response times to ensure a seamless user experience. If cost efficiency is a priority, set alarms for unexpected spikes in resource usage or idle resources to avoid unnecessary expenses.
By tailoring your CloudWatch Alarms to your unique needs, you can proactively address issues before they impact your operations or budget. For more detailed guidance, consider exploring resources like expert blogs on AWS optimisation tailored for SMBs.
How can SMBs reduce unnecessary CloudWatch alarm notifications while ensuring they stay informed about critical issues?
To minimise unnecessary alert noise and focus on critical notifications, SMBs can adopt a few best practices when setting up CloudWatch alarms. First, prioritise key metrics that align with your business goals, such as CPU utilisation, memory usage, or billing thresholds. Avoid setting alarms for every metric, as this can lead to information overload. Instead, focus on the metrics that directly impact performance, cost, or customer experience.
Second, use composite alarms to group related alarms and reduce the number of notifications. For example, instead of receiving multiple alerts for individual metrics, you can configure a composite alarm to trigger only when multiple conditions are met. This helps to streamline alerts and ensures you’re notified only when genuinely critical issues arise.
Finally, configure different notification channels based on severity. For example, send high-priority alerts to email or SMS for immediate action, while less critical notifications can be routed to a Slack channel or a monitoring dashboard. By tailoring your notification strategy, you can stay informed without being overwhelmed by unnecessary alerts.
How can anomaly detection in CloudWatch Alarms enhance monitoring for workloads with seasonal or dynamic patterns?
Anomaly detection in CloudWatch Alarms uses machine learning to automatically identify unusual patterns in your metrics, making it ideal for workloads with seasonal or dynamic variations. Unlike static thresholds, which require predefined limits, anomaly detection adjusts dynamically based on historical data, helping you spot irregularities without constant manual adjustments.
This approach is particularly useful for small and medium-sized businesses (SMBs) that experience fluctuating traffic or demand, such as during holiday seasons or promotional events. By proactively identifying anomalies, you can address performance issues early and optimise costs effectively, ensuring smoother operations.

