Checklist for Scaling AWS Monitoring and Alerts
Learn how to effectively scale your AWS monitoring and alerts to enhance performance, reduce costs, and maintain security as your business grows.
Managing AWS resources as your business grows can be challenging. Without proper monitoring, you risk downtime, security issues, and rising costs. Here's what you need to know:
- Start with Key Metrics: Monitor CPU, memory, and storage for EC2, RDS, and S3. Misconfigured alarms cause 73% of performance issues.
- Set Smart Alerts: Use CloudWatch alarms with dynamic thresholds to reduce downtime by 40% and improve performance by 30%.
- Centralise Monitoring: Combine logs across accounts using CloudWatch Logs Insights and AWS Organisations for a unified view.
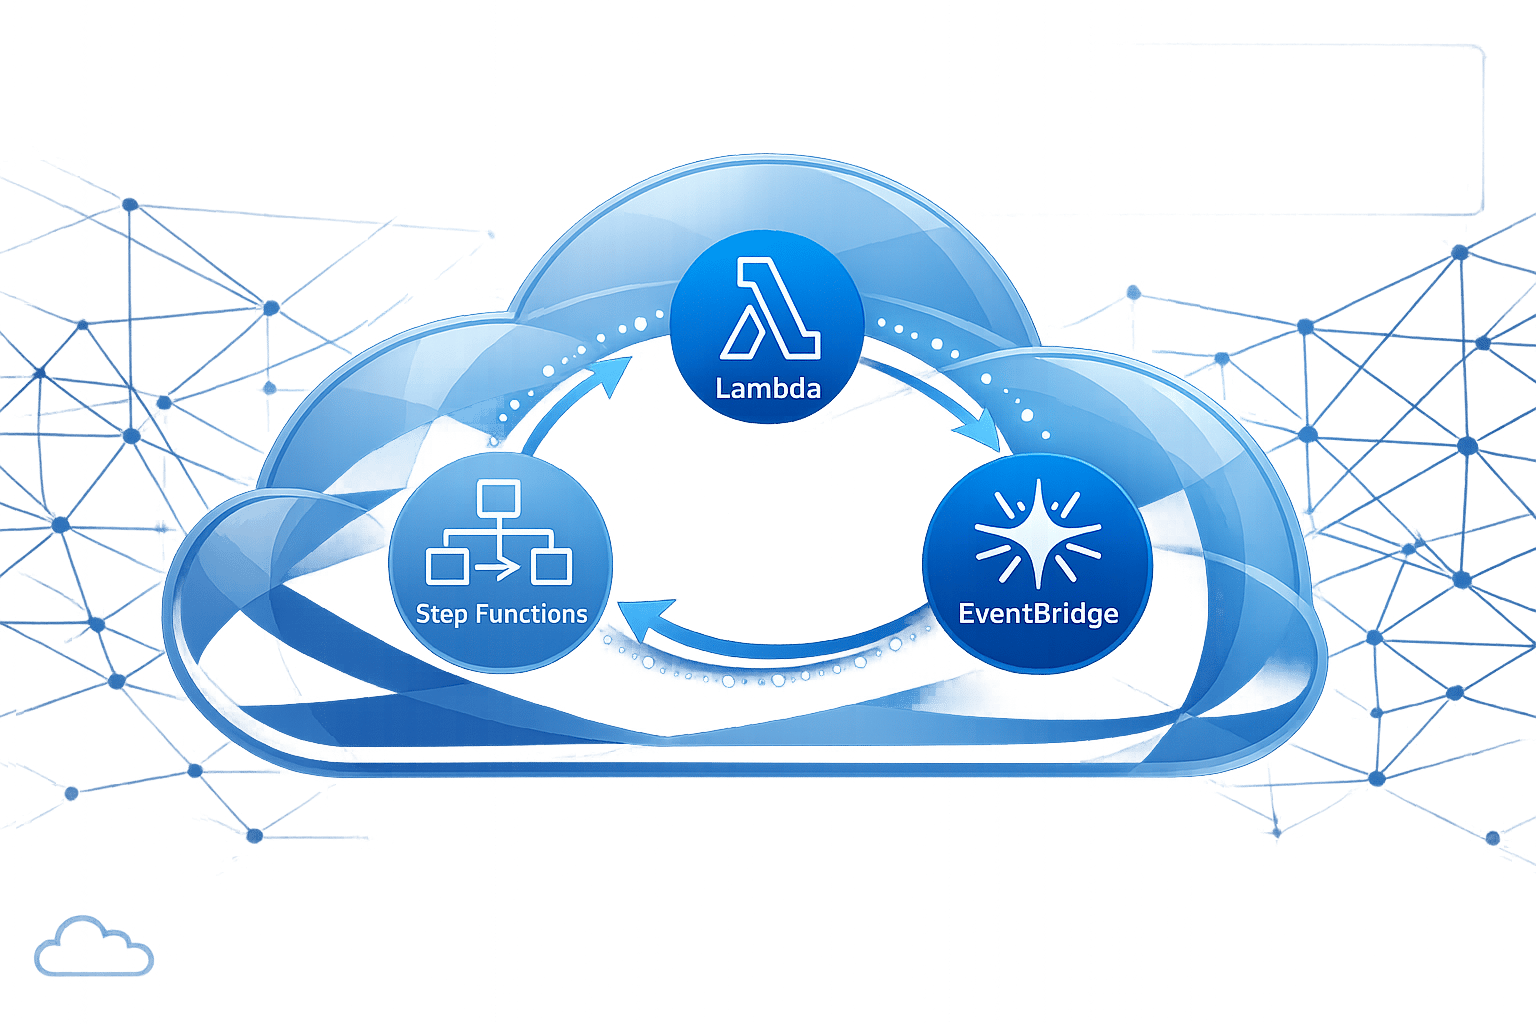
- Automate Responses: Use AWS Lambda and EventBridge for self-healing systems and auto-scaling resources efficiently.
- Control Costs: Identify unused resources, optimise log storage, and set cost alerts with AWS Budgets to avoid overspending.
Effective monitoring ensures system reliability, reduces costs, and enhances security as your AWS infrastructure scales. Dive into the details to optimise your setup and achieve these outcomes.
Monitoring AWS Resources with CloudWatch Logs, Alarms & Triggers
Setting Up Basic AWS Metrics and Alerts
Understanding and tracking the right AWS metrics is crucial for maintaining system performance. Interestingly, 73% of AWS users face performance issues due to misconfigured CloudWatch alarms.
Key Performance Metrics
Amazon CloudWatch is your go-to tool for monitoring vital metrics. Here are some of the most important ones to keep an eye on:
EC2 Instance Metrics:
- CPU usage
- Memory usage
- Disk I/O activity
- Network performance
Database Performance (RDS):
- Number of active connections
- Query execution times
- Available storage
- Replica lag
Storage and Function Metrics:
- Latency for S3 requests
- Error rates in Lambda executions
- Response times for API Gateway
Setting Alert Thresholds
Using CloudWatch alarms effectively can make a big difference. Companies that integrate these alarms often see 40% less downtime and 30% better application performance. To make the most of them, leverage CloudWatch metric math to set dynamic thresholds. This allows you to account for patterns like historical trends, time-of-day variations, and even seasonal fluctuations.
Take CalvertHealth as an example. This Maryland-based hospital reworked its monitoring system with AWS Elastic Disaster Recovery and precise alert thresholds. The result? They slashed their recovery time objective from a staggering 72 hours to just under 2 hours. By fine-tuning thresholds, they established a structured, multi-level alert system that prioritised critical issues.
Multi-Level Alert System
A tiered alert system is a smart way to manage notifications. Categorise alerts by their severity - ranging from informational updates to warnings about metrics nearing critical levels. This approach not only reduces unnecessary notifications (alert fatigue) but also ensures that the most pressing issues are addressed promptly.
Best Practices for Alert Configuration
Here are some tips to get the most out of your alert setup:
- Define thresholds that align with your business priorities.
- Set early warning thresholds to catch potential problems before they escalate.
- Use different communication channels depending on the urgency of the alert.
- Build in time tolerance to minimise false alarms.
- Regularly review and tweak thresholds to match changes in system behaviour.
For small and medium-sized businesses, the AWS free tier offers a great starting point. It includes 10 custom metrics, 5 GB of log data ingestion, and 3 dashboards, making it easier to implement effective monitoring without breaking the bank.
Creating a Central Monitoring Hub
Building a central monitoring hub is essential for keeping a clear view of your AWS infrastructure as it grows. It allows you to identify and resolve issues promptly.
Combining Service Logs
To streamline log monitoring across multiple accounts, use CloudWatch Logs Insights alongside cross-account observability. This setup supports monitoring logs from as many as 100,000 accounts. By integrating AWS Organisations, you can link all accounts to a single monitoring account. Tools like AWS Control Tower simplify this process by automatically setting up a centralised log archive and audit account.
"We recommend that you use CloudWatch cross-account observability for the richest cross-account observability and discovery experience within a Region for your metrics, logs, and traces."
- Amazon Web Services
Once you've centralised your logs, the next challenge is managing their storage effectively.
Log Storage Rules
Setting clear log retention policies is crucial for balancing compliance requirements with cost management. For example, if you're generating 5 GB of logs daily, that adds up to about 1.8 TB annually, which could cost approximately £640.
Here’s how to structure your log storage:
- Short-term (1–3 months): Keep logs in CloudWatch. Enable detailed logging and set up automatic cleanup to prevent unnecessary storage costs.
- Medium-term (3–12 months): Move logs to S3 Standard. This tier is ideal for meeting compliance needs while ensuring quick access for audits.
- Long-term (1+ years): Archive logs to S3 Glacier using lifecycle policies to minimise storage expenses.
Once storage is optimised, the next step is setting up alert systems to catch issues early.
Log-Based Alert Triggers
Proactive issue detection relies on well-configured alert triggers. Use metric filters and Logs Insights queries to identify critical patterns before they escalate.
Here’s how to set this up:
- Metric Filters: Convert log data into actionable metrics. For example, track patterns like authentication failures or connection errors.
- Thresholds and Notifications: Define thresholds for these metrics and link them to SNS topics to receive instant alerts.
- Composite Alarms: Group related alerts into composite alarms to reduce noise and focus on the most critical issues.
Alert Response Automation
Centralised monitoring is just the beginning - automated responses take it a step further by ensuring quick, accurate actions when alerts are triggered. By automating these responses, you can maintain system reliability while freeing up your team to focus on more strategic priorities.
Auto-Scaling Rules
Target tracking policies are a game-changer for auto-scaling, as they adjust resources based on real-time metrics. Here's how to fine-tune your auto-scaling settings:
- Adjust monitoring intervals to 1 minute instead of the default 5 minutes for quicker response times.
- Start with a 70% target utilisation rate and activate predictive scaling.
- Enable predictive scaling to prepare for anticipated increases in workload.
While auto-scaling efficiently manages capacity, automated remediation steps in to handle service recovery when needed.
Self-Fixing Systems
Tools like AWS Lambda and EventBridge can automatically resolve common issues without human intervention. For example, AWS introduced version 2.2.1 of their Automated Security Response solution in January 2025. This tool tackles security issues across multiple AWS accounts, logs all actions in detail, and notifies relevant teams.
To take automation further, integrate self-healing features into your monitoring setup. Here's how various components can work together:
| Component | Role | Implementation |
|---|---|---|
| Health Checks | Continuous monitoring | Configure ELB health checks to automatically remove unhealthy instances. |
| Recovery Actions | Automatic issue resolution | Use Lambda functions to restart services or update DNS records. |
| Failover Systems | High availability | Deploy RDS in Multi-AZ mode for automatic database failover. |
These elements ensure that your systems can recover quickly and maintain smooth operations.
Scaling Safety Controls
Scaling automation is powerful, but it needs proper safeguards to ensure stability and prevent resource misuse. Consider these measures:
- Use gradual scaling and set thresholds to avoid overloading resources.
- Opt for instance fleets to allow flexibility in selecting instance types during scaling events.
- Define scaling thresholds tailored to your application's specific needs.
For instance, a media streaming service leveraged predictive scaling and Spot Instances for non-critical workloads. This strategy cut EC2 costs by 40% while maintaining 99.9% availability - even during peak periods when traffic tripled. By implementing these safety controls, you can ensure that automated scaling aligns with your overall operational goals.
Monitoring Cost Control
Keeping AWS monitoring costs in check is just as important as maintaining performance and automation. Without proper oversight, expenses can spiral out of control, impacting your bottom line.
Cost Alert Setup
Managing AWS spending becomes increasingly crucial as your infrastructure grows. Tools like AWS Budgets are a solid choice for setting up customised alerts to track spending patterns effectively.
Here’s how to set up cost monitoring that works:
-
Create Layered Budget Alerts
Set up multiple thresholds to catch spending issues early. For instance:- Preliminary alerts for minor deviations
- Warning alerts for concerning trends
- Critical alerts for major overspending
-
Enable Service-Specific Monitoring
Focus on key services like:- CloudWatch Logs storage: £0.03 per GB per month
- Log ingestion: £0.50 per GB
- Contributor Insights analysis: Starting at £0.30 per GB
"AWS Budgets are the simplest way to monitor your AWS spend and be alerted when you exceed or forecasted to exceed your desired spending limit".
Finding Unused Resources
Unused resources can quietly drain your budget. AWS offers tools to help you identify and eliminate these inefficiencies:
| Resource | Detection Method | Potential Savings |
|---|---|---|
| Development Instances | CloudWatch CPU metrics | Up to 65% by scheduling usage |
| Unused Volumes | AWS Trusted Advisor | Varies by volume size |
| Idle Load Balancers | Cost Explorer | Savings of up to 30% |
To streamline this process, you can automate clean-up tasks with Lambda functions. For example, these can identify and shut down instances with consistently low CPU utilisation.
Log Storage Cost Management
Log storage can be a hidden cost, but a structured approach can help you cut down on unnecessary expenses. Try this three-step strategy:
-
Storage Optimisation
- Move inactive logs to cheaper storage tiers.
- Compress log data and apply filters to focus on key insights.
- Use metric filters to track only the most critical data points.
-
Retention Management
- Set retention periods that balance compliance with cost savings.
- Automatically delete non-essential logs.
- Archive important logs to lower-cost storage options.
-
Analysis Efficiency
- Use AWS CloudWatch Contributor Insights sparingly, targeting only critical logs.
For more tips on managing AWS costs and improving monitoring strategies, check out AWS Optimization Tips, Costs & Best Practices for Small and Medium-sized Businesses.
Conclusion
Cloud-enabled organisations experience 35% fewer unplanned outages, highlighting the critical role of effective monitoring in maintaining business continuity.
A successful monitoring strategy hinges on three main pillars:
Automation and Efficiency
Automation not only minimises manual errors but also speeds up response times. For example, Smartsheet managed to cut deployment times from hours to mere minutes. AWS tools like CloudWatch and CloudTrail provide a solid starting point, while third-party solutions can deliver more detailed insights.
Cost-Effective Scaling
Smart monitoring can uncover opportunities to reduce costs without sacrificing performance. Take Aligned Technology Group, for instance - they slashed their monthly costs by 51% by identifying and removing unused resources through consistent monitoring. Regularly analysing resources and optimising their usage ensures your monitoring setup grows efficiently alongside your business.
Security and Compliance
As AWS usage expands, keeping systems secure becomes increasingly challenging. Prioritising security monitoring protects critical assets, builds trust, and can even open doors to new business opportunities. CalvertHealth’s success is a great example - they reduced their recovery time objective (RTO) by 97% thanks to a strategic approach to AWS monitoring tools. Integrating strong security practices into your scaling efforts ensures your systems remain resilient as your AWS environment evolves.
For small and medium-sized businesses (SMBs) just starting their journey, AWS Managed Services offers tailored tools and oversight to maintain stability and keep costs under control. Regularly reviewing and refining your monitoring systems will support steady and sustainable AWS growth.
Ultimately, effective AWS monitoring demands a system that adapts to your business's changing needs, all while maintaining security and controlling expenses.
For more in-depth advice on optimising AWS infrastructure, check out AWS Optimization Tips, Costs & Best Practices for Small and Medium-sized Businesses.
FAQs
How can I use dynamic thresholds in CloudWatch alarms to enhance AWS monitoring for my growing business?
Dynamic thresholds in AWS CloudWatch alarms offer a smarter way to monitor your systems by adjusting to changes in behaviour over time. Leveraging anomaly detection, these thresholds use historical data to create a confidence band around typical performance metrics. Alarms are triggered only when metrics stray significantly outside this band, cutting down on false alerts and allowing you to focus on real issues.
To maximise the benefits of dynamic thresholds, it’s important to periodically review and fine-tune your alarm settings as your system evolves. This ensures your monitoring keeps pace with your business's growth and shifting usage patterns. By integrating this method, you can keep a dependable and efficient watch over your AWS resources, even as they scale.
How can I set up a centralised monitoring hub using AWS Organisations and CloudWatch Logs Insights?
To build a centralised monitoring hub using AWS Organisations and CloudWatch Logs Insights, here’s what you need to do:
- Create a central logging account: Start by setting up a dedicated AWS account specifically for collecting and managing logs from all accounts within your organisation. This simplifies access and makes it easier to analyse data across your AWS environment. Use AWS CloudTrail to track API activity and configuration changes, boosting both security and audit capabilities.
- Enable cross-account observability: Connect your source accounts to the central logging account. This setup allows you to monitor logs from multiple accounts in one place, giving you a unified view of your AWS resources and making troubleshooting much more straightforward.
- Use CloudWatch Logs Insights: Take advantage of this tool to query and analyse log data effectively. Its flexible query language helps you pinpoint problems quickly and confirm solutions as your operations expand.
Following these steps will help you build a robust AWS monitoring system that can scale effortlessly as your business grows.
How can I automate AWS alerts to improve system reliability and reduce manual work?
To keep your AWS system running smoothly, you can rely on Amazon CloudWatch and AWS Lambda for automated alerts and actions. CloudWatch enables you to monitor specific metrics and set alarms that trigger automatic responses when thresholds are crossed. For example, you might configure alarms to scale or restart EC2 instances based on their performance.
With AWS Lambda, you can take these alerts a step further by executing custom actions. This might include tasks like scaling resources, restarting services, or sending notifications through Amazon SNS. For instance, a CloudWatch alarm could activate a Lambda function to address particular issues or error patterns, cutting down on the need for manual fixes. This combination not only helps keep your system stable but also saves time and reduces the likelihood of human mistakes.