Build AWS Cost Dashboard with QuickSight
Learn to build an AWS Cost Dashboard with QuickSight for effective cost tracking and reporting, enhancing financial decision-making.
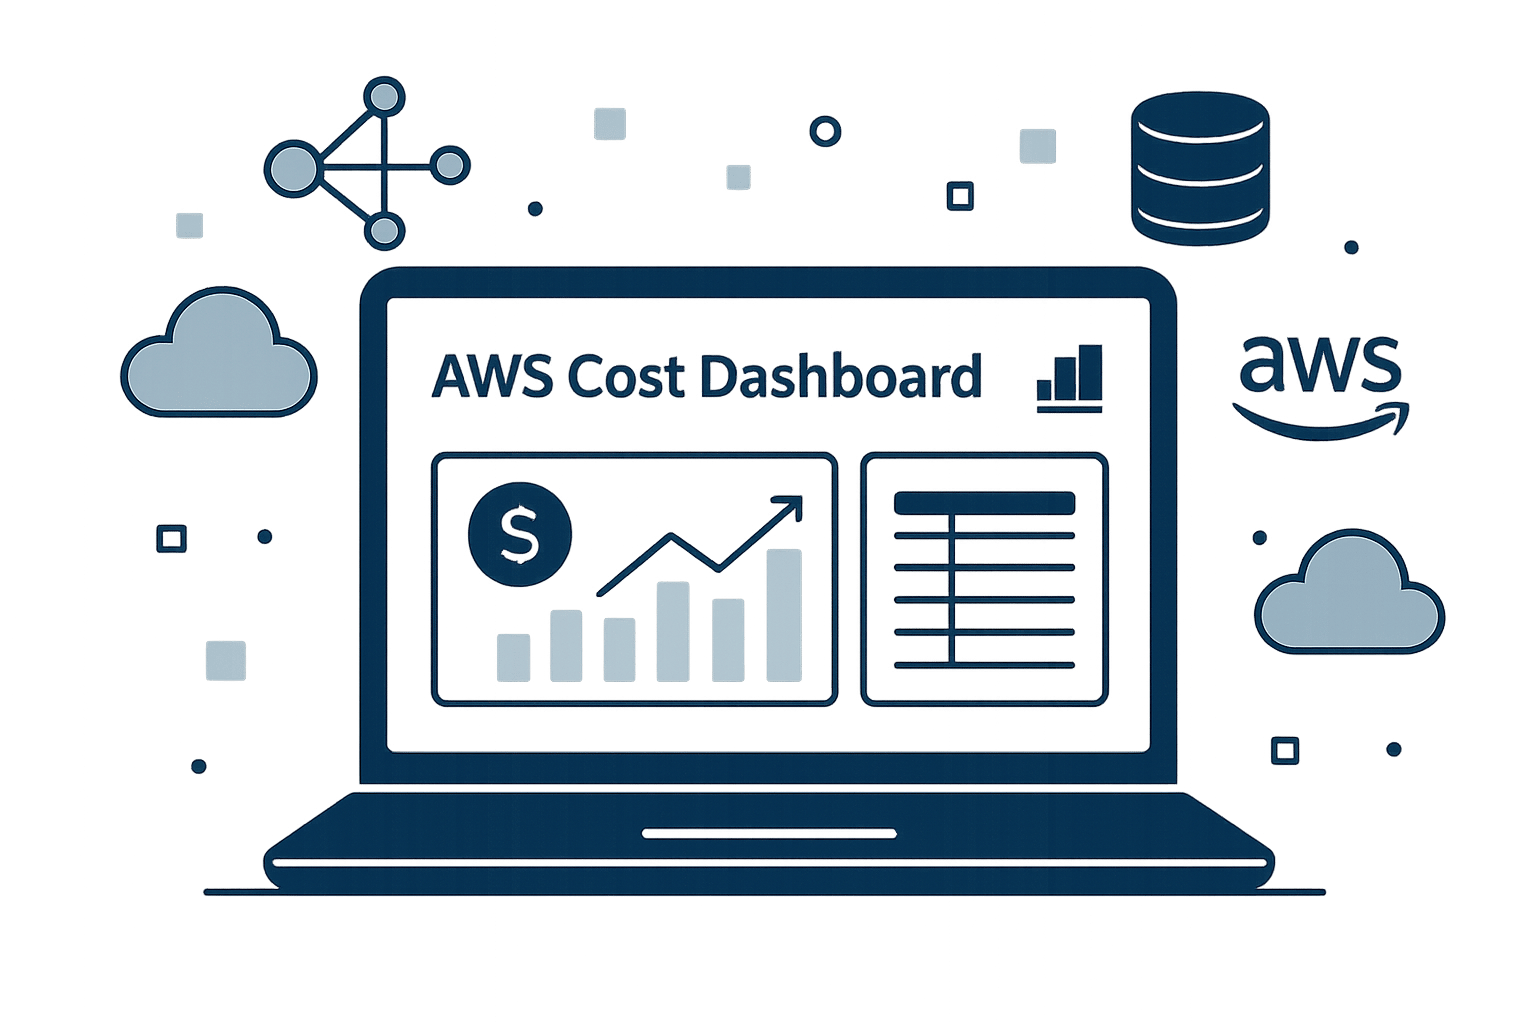
Want to track and control your AWS spending effectively? Amazon QuickSight lets you create interactive dashboards to monitor costs, spot trends, and manage budgets for your business.
Key Takeaways:
- Simplify cost tracking: Use visualisations like line charts and KPIs to understand spending patterns.
- Customise insights: Add filters for time periods, services, or tags like Project and Environment.
- Automate reporting: Schedule daily, weekly, or monthly updates to keep your team informed.
- Ask questions: Use QuickSight Q for instant answers, e.g., "What were last month's EC2 costs?"
Quick Setup Steps:
- Enable AWS Cost & Usage Reports (CUR) in the Billing Console.
- Store reports in an S3 bucket and connect them to QuickSight.
- Create charts like line graphs for trends and bar charts for service comparisons.
- Add filters and assign team-specific access.
Outcome: Gain real-time insights, allocate costs by project, and avoid unexpected bills - all within a user-friendly dashboard.
AWS Cost and Usage Report integration with Amazon ...
Setup Requirements
Here’s how to configure the components needed for accurate cost tracking:
Required Access and Permissions
To build your AWS cost dashboard, you’ll need specific permissions across various AWS services. Here’s a breakdown:
| Service | Required Permissions | Purpose |
|---|---|---|
| QuickSight | QuickSight Admin | Create and manage dashboards |
| AWS Billing | Billing Console Access | Enable cost reporting |
| IAM | Cost Explorer Access | Retrieve and analyse data |
| S3 | Read/Write Access | Store cost reports |
Once you’ve secured these permissions, you can move on to configuring your cost reports.
Cost and Usage Reports Setup
Follow these steps to set up your Cost and Usage Reports in the AWS Billing Console:
- Go to the AWS Billing Console.
- In the left menu, select Cost & Usage Reports.
- Click Create report and configure the following:
- Report name:
quicksight-cost-dashboard - Time granularity: Hourly
- Include resource IDs: Yes
- S3 bucket: Either create a new bucket or use an existing one
- Report path prefix:
cur/quicksight-dashboard
- Report name:
Data Quality Checks
To ensure your data is accurate and useful, perform these checks:
-
Tag Verification
Set up cost allocation tags to monitor spending by categories such as:- Project
- Environment
- Department
- Cost Centre
-
Account Configuration
If you’re using AWS Organizations:- Enable Cost Explorer for all accounts.
- Apply consistent tagging policies.
- Set up IAM roles for cross-account access.
-
Data Validation
Verify the accuracy of your data by:- Checking for any missing cost entries.
- Ensuring reports include all relevant AWS services.
Creating Your Dashboard
Build your AWS cost dashboard in QuickSight to keep track of your expenses effectively.
Setting Up Charts and Graphs
Here’s how to set up visualisations to track your costs:
| Chart Type | Purpose | Key Metrics |
|---|---|---|
| Line Chart | Show monthly cost trends | UnblendedCost by date |
| Bar Chart | Compare costs by service | Cost by ServiceName |
| Treemap | Display cost distribution | Usage by resource tags |
| KPI Cards | Highlight critical metrics | Month-over-month change |
How to arrange your charts:
- Place KPI cards at the top for quick insights.
- Add the trend line chart below to show historical trends.
- Position service comparison charts on the right for easy side-by-side analysis.
- Include detailed breakdowns at the bottom for deeper insights.
Once your charts are set up, enhance your dashboard by adding interactive filters.
Adding Filters
Filters help you dig deeper into your cost data. Add these to your dashboard:
-
Time Period Filter
- Default to the current month.
- Offer options like the last 7 days, 30 days, 3 months, and 12 months.
- Include a custom date range selector for flexibility.
-
Service Category Filter
- Group services by categories such as Compute, Storage, or Database.
- Allow multi-select for comparing multiple services at once.
-
Tag-Based Filters
- Filter by tags like Environment (Dev, Staging, Production), Cost Centre, or Project Code for more granular analysis.
Dashboard Management
Make the most of QuickSight dashboards to keep an eye on AWS costs and streamline automation.
Team Access and Reports
Set up dashboards with tailored access based on team roles:
| Role | Access Level | Capabilities |
|---|---|---|
| Finance Team | Admin | Edit dashboards, create reports |
| Project Managers | Enhanced Viewer | Perform custom analysis, modify filters |
| Development Teams | Viewer | View dashboards with preset filters |
Schedule regular reports to keep everyone informed:
- Daily: Summaries of the previous day's spending
- Weekly: Digests highlighting week-over-week trends
- Monthly: Detailed breakdowns by cost category
To integrate cost data into your internal tools or intranet, use QuickSight's secure embedding API for a seamless experience.
Enhance usability further by refining interactive queries, making it easier for teams to dive into the details they need.
Using Amazon QuickSight Q
QuickSight Q allows you to ask natural language questions about your AWS costs. Examples include:
- "What were EC2 costs for the last quarter?"
- "How do storage costs compare between production and development?"
- "Which services saw the largest cost increase last month?"
For accurate results, ensure consistent tagging across AWS resources. This helps QuickSight Q interpret questions related to cost centres, projects, or environments effectively.
Conclusion
Building on the steps outlined for setting up and creating your dashboard:
Summary
A QuickSight dashboard turns raw cost data into clear, actionable insights for small and medium-sized businesses (SMBs).
Some key advantages include:
- Real-time monitoring: Stay updated on spending with accurate, up-to-the-minute data.
- Team collaboration: Provide tailored access levels to share relevant cost metrics.
- Automated reporting: Schedule regular updates to keep teams informed without manual effort.
- Natural language queries: Use QuickSight Q to quickly find answers to cost-related questions.
This dashboard becomes a central tool for making informed financial decisions, helping to manage AWS costs and improve efficiency.
Further Resources
To get the most out of your QuickSight cost dashboard:
- Review visualisations regularly: Check every quarter to ensure they remain relevant and useful.
- Validate your data: Perform monthly quality checks to maintain accurate reporting.
- Train your team: Hold periodic sessions to ensure everyone can use the dashboard effectively.
For more tips and detailed tutorials, visit AWS Optimization Tips, Costs & Best Practices for Small and Medium sized businesses. This blog provides expert advice tailored to SMBs managing AWS infrastructure.
FAQs
How can I keep my AWS Cost Dashboard accurate and up-to-date?
To ensure your AWS Cost Dashboard remains accurate and up-to-date, make sure you integrate it with the latest AWS Cost and Usage Reports (CUR) and configure regular data refresh schedules in Amazon QuickSight. This will automatically pull in the most recent cost and usage data.
Additionally, double-check your data sources and permissions to ensure they are correctly configured. For example, verify that your IAM roles and policies allow QuickSight to access the necessary AWS billing data. Regularly reviewing your dashboard's filters and metrics can also help maintain its relevance and accuracy.
For small and medium-sized businesses (SMBs), exploring cost optimisation tips and best practices tailored to AWS usage can further enhance your dashboard's value. This can help you identify trends and opportunities to reduce costs effectively.
How can QuickSight Q enhance my AWS Cost Dashboard with natural language queries?
QuickSight Q allows you to interact with your AWS Cost Dashboard using natural language queries, making it easier to analyse and explore data without needing technical expertise. For example, you can simply type questions like 'What were my AWS costs in September?' or 'Which services cost the most last quarter?' and get instant visualisations and insights.
This feature is particularly useful for small and medium-sized businesses (SMBs) looking to save time and make data-driven decisions quickly. By simplifying data exploration, QuickSight Q can help you uncover trends, identify cost-saving opportunities, and optimise your AWS usage effectively.
What permissions are required to create and manage an AWS Cost Dashboard in QuickSight?
To create and manage an AWS Cost Dashboard in QuickSight, you will need specific permissions for both Amazon QuickSight and AWS Cost and Usage Reports (CUR). At a minimum, ensure you have permissions to:
- Access and manage QuickSight (e.g.,
quicksight:CreateDashboard,quicksight:UpdateDashboardPermissions). - Retrieve and query cost and usage data from AWS (e.g.,
cur:DescribeReportDefinitions,s3:GetObject).
Check with your AWS administrator to confirm you have the required roles or policies assigned. If you're unsure, refer to the AWS documentation on IAM roles for QuickSight and CUR integration.