AWS Network Firewall Rules: Troubleshooting Guide
Troubleshoot AWS Network Firewall rules: evaluation order, HOME_NET/EXTERNAL_NET issues, asymmetric routing, logging and Suricata fixes.
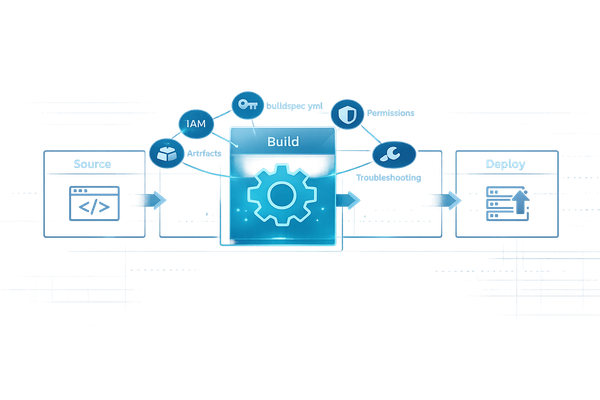
AWS Network Firewall is a tool designed to secure Amazon VPCs by monitoring and filtering network traffic. Misconfigurations in firewall rules can lead to issues like dropped traffic, vulnerabilities, or unexpected behaviour. Here's a quick summary of what you need to know to troubleshoot effectively:
- Rule Evaluation Order: Understand the difference between "Action Order" (default) and "Strict Order". Action Order prioritises actions (
pass,drop, etc.), while Strict Order processes rules in sequence. - Common Issues:
- Traffic dropped due to asymmetric routing.
- Misconfigured variables like
HOME_NETandEXTERNAL_NET. - Overlapping or conflicting rules.
- Inspection depth limits on large data transfers.
- Key Fixes:
- Use tools like VPC Reachability Analyzer to check routing paths.
- Adjust
HOME_NETto include all relevant CIDR ranges. - Create specific rules for both directions of traffic in stateless configurations.
- Enable logging (
Alert allorAlert established) to debug issues effectively.
- Using Logs: Analyse flow, alert, and TLS logs in CloudWatch or S3 to identify problematic traffic patterns or rule conflicts.
Stop Using AWS Network Firewall Wrong (Stateful Rule Secrets)
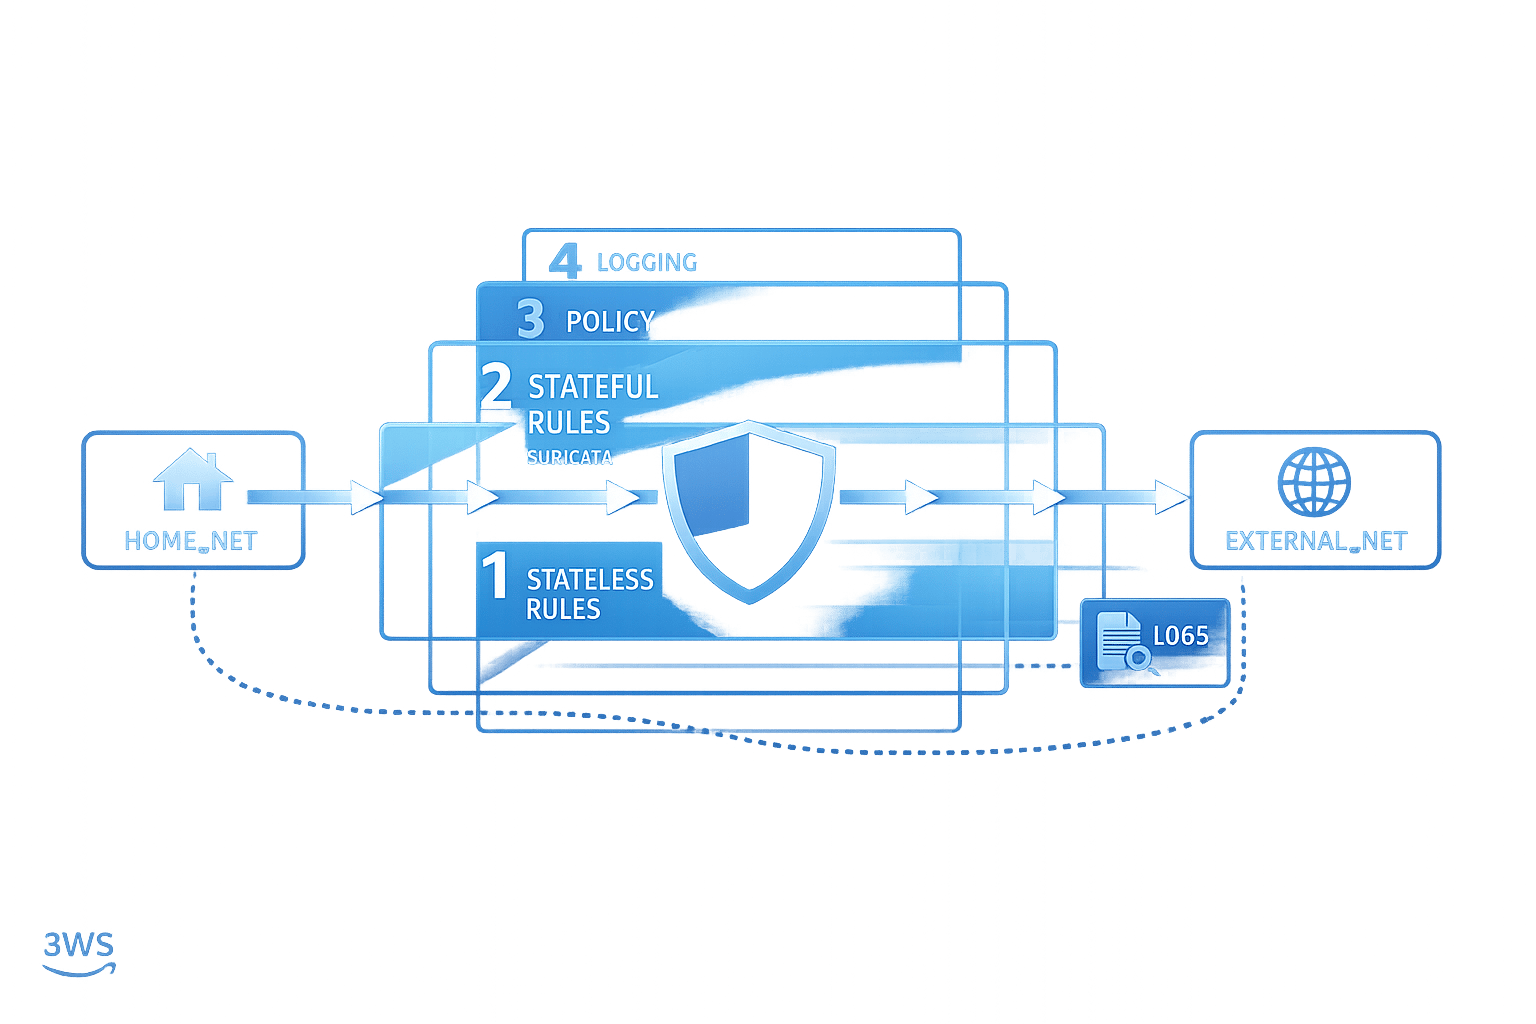
Understanding Rule Evaluation and Processing Orders
AWS Network Firewall Rule Evaluation: Action Order vs Strict Order Comparison
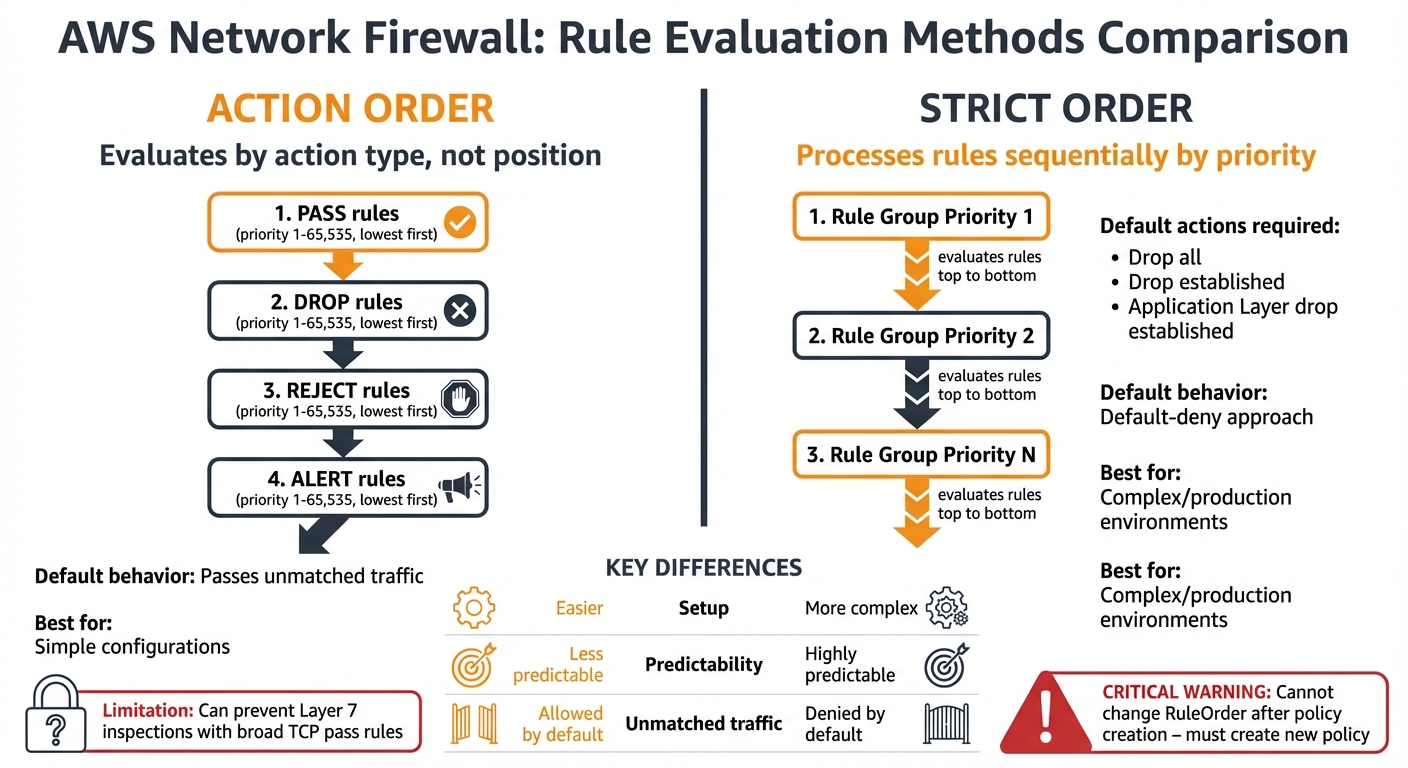
AWS Network Firewall offers two methods for processing rules: Action Order and Strict Order. These modes determine how traffic is evaluated, and choosing the wrong one is a frequent issue for SMBs looking to optimize costs.
In Action Order, the stateful engine evaluates rules based on their action type rather than their position in the configuration. The evaluation follows a specific hierarchy: pass rules are processed first, followed by drop, then reject, and finally alert. It’s important to note that pass rules take precedence over all others. Within each action type, the rules are ordered by the priority keyword (ranging from 1 to 65,535), with lower numbers processed first.
Strict Order, on the other hand, processes rule groups based on their assigned priority number, starting with the lowest, and evaluates rules in the exact sequence they’re defined. This mode also requires you to specify default actions for unmatched traffic. Options include Drop all, Drop established, or Application Layer drop established. Unlike Action Order, which defaults to passing unmatched traffic, Strict Order enforces a "default-deny" approach, which is often better suited for production environments.
The following sections break down these methods and provide tips for resolving conflicts.
Action Order vs Strict Order: What's the Difference?
The differences between these modes go beyond how rules are evaluated. Action Order is easier to set up initially but can introduce issues as your ruleset grows. For example, a broad TCP pass rule might prevent Layer 7 inspections from taking place.
Strict Order, while more predictable, is ideal for complex configurations. However, there’s a key limitation to keep in mind: the RuleOrder setting can only be specified when creating the firewall policy and cannot be changed later. If you need to switch modes, you’ll have to create a new policy from scratch.
Strict Order also requires careful attention to default actions. With a Drop established default action, legitimate TCP control packets might be unexpectedly dropped. For instance, while the firewall allows the initial Layer 3 and Layer 4 handshake, it will drop the flow once established unless a specific pass rule is in place. To avoid this, you’ll need to create rules for TCP window updates, keep-alives, and resets.
How to Fix Rule Conflicts
Resolving rule conflicts often comes down to understanding how rules interact and ensuring they’re applied in the correct context.
Conflicts frequently occur when rules overlap or when protocol timing leads to unexpected matches. A common issue involves Layer 4 rules being triggered before Layer 7 inspection can take place. For example, a general TCP rule might match during the handshake, stopping the firewall from evaluating an HTTP-specific rule.
To address this, use the flow:to_server or flow:established keywords in your Layer 7 rules. These keywords delay rule application until the application protocol is identifiable. Instead of relying on a broad TCP rule, use flow:to_server; to ensure inspection happens within the right context.
In Action Order, enabling Alert logs can help you identify whether a pass rule is overriding a drop rule . If you’re using Strict Order with a Drop established default action, consider enabling Alert established to log all dropped traffic. This approach allows you to see what would be blocked without immediately disrupting legitimate traffic, giving you time to fine-tune your ruleset.
Another common issue involves directional operators. Using the bidirectional operator <> can unintentionally allow external entities to initiate connections into your VPC. To avoid this, replace it with the -> operator and pair it with flow:to_server to ensure traffic flows only in the intended direction.
Fixing Variable Misconfigurations
Variable misconfigurations are a frequent issue, especially during the initial setup of centralised AWS Network Firewall deployments. Two key variables, HOME_NET and EXTERNAL_NET, determine what traffic is classified as internal or external. If these are configured incorrectly, your entire ruleset may fail, leaving your network vulnerable.
By default, HOME_NET is set to the CIDR range of the firewall VPC. This default can cause problems because traffic from other VPCs (spoke VPCs) won't be recognised as internal unless you manually adjust the variable. Without including the CIDR ranges for these spoke VPCs, stateful rules and managed rule groups meant to filter outgoing traffic won't function properly. As a result, your workloads may be exposed, even if the firewall appears to operate normally. Below, you'll find steps to correctly configure both HOME_NET and EXTERNAL_NET.
Setting HOME_NET for Centralised and Spoke VPCs
To ensure all traffic is properly classified, configure HOME_NET at the firewall policy level to include all private IP ranges specified in RFC 1918: 10.0.0.0/8, 172.16.0.0/12, and 192.168.0.0/16. This approach covers all spoke VPCs and eliminates the need to update the variable whenever a new VPC is added.
In setups using domain list filtering within a centralised architecture, it's necessary to manually update HOME_NET in the rule group itself to include the CIDR ranges of the spoke VPCs. This step is crucial because the default configuration only filters traffic originating from the inspection VPC.
To confirm your configuration, you can deploy a custom Suricata canary rule like this one:
alert tcp !$HOME_NET any -> !$HOME_NET any (flow:to_server,established; msg:"Traffic detected outside HOME_NET scope"; sid:39179777;).
This rule flags any traffic that falls outside the defined HOME_NET scope, making misconfigurations easy to spot in your logs.
Configuring EXTERNAL_NET Negation Across Rule Groups
At the policy level, EXTERNAL_NET is automatically set as the inverse of HOME_NET. For instance, if HOME_NET is defined as 10.0.0.0/8, then EXTERNAL_NET becomes !10.0.0.0/8. However, issues arise when a rule group overrides HOME_NET without explicitly redefining EXTERNAL_NET. This creates what’s known as an "inheritance trap". In such cases, the rule group inherits EXTERNAL_NET from the policy level, which is based on the policy’s HOME_NET setting rather than the rule group’s customised configuration.
For example, if the policy-level HOME_NET is 11.0.0.0/24, and a rule group changes it to 10.0.0.0/16 without updating EXTERNAL_NET, the firewall will still use !11.0.0.0/24 for that rule group. This mismatch can lead to unintended traffic being allowed or legitimate traffic being blocked.
To avoid this, always define both HOME_NET and EXTERNAL_NET together within custom rule groups. This ensures their inverse relationship remains intact and prevents logic errors in traffic classification.
Resolving Stateful Rule Engine and Stream Handling Problems
The stateful rule engine in AWS Network Firewall has some restrictions that can cause rules to fail mid-flow. For instance, the engine has a maximum packet size limit, which can interrupt rule matching once the flow surpasses the inspection depth. This means that any traffic after this point might bypass the rules, leading to inconsistent behaviour.
These constraints are particularly noticeable with long-lived connections or large data transfers. Take this example: you’ve configured a drop rule for TCP port 80. While it might block small HTTP requests effectively, it could fail when users attempt to download large files. Once the firewall hits its internal limit, it stops inspecting the stream, allowing unchecked packets to pass through. Let's look at how to detect and address these inspection depth issues.
Packet Size Limits and Stream Event Alerts
To spot flows that exceed the firewall's inspection depth, you can use the Suricata keyword stream-event:reassembly_depth_reached; in a custom alert rule. This method helps identify connections that surpass the firewall's processing capacity. For example, if a drop rule appears to fail intermittently, you might deploy an alert rule like this:
alert tcp $HOME_NET any -> $EXTERNAL_NET 80 (flow:established,to_server; stream-event:reassembly_depth_reached; flowbits: set, stream_reassembly_depth_reached; classtype:protocol-command-decode; sid:1;).
This rule generates an alert whenever the reassembly depth limit is reached, helping explain why subsequent rules might not activate.
Make sure your firewall policy's stateful default actions are set to "Alert all" or "Alert established". Without this configuration, dropped flows won’t produce log alerts, making problem-solving much harder. Additionally, for strict order policies, place diagnostic stream-event rules above the rules being investigated to ensure they trigger as intended.
Fixing TCP Reassembly Issues
TCP reassembly challenges arise when the firewall struggles to detect application-layer protocols because the necessary data appears late in the stream. This issue often occurs with fragmented TLS Client Hello messages, especially during post-quantum hybrid cipher key exchanges. If such traffic is dropped before the handshake completes, the firewall cannot extract the SNI field required for domain-based filtering.
To address this, change the default action from "Drop all" to "Application drop established". This ensures the firewall waits for enough application-layer data before making a decision. Adding the flow:to_server; keyword in your rules also prompts the firewall to wait until the application protocol is fully identified. For production environments, set the Stream exception policy to "Continue".
| Issue Type | Impact | Resolution |
|---|---|---|
| Inspection Depth Limit | Rules stop matching after a certain volume of data | stream-event:reassembly_depth_reached |
| TCP Reassembly Issues | Application layer protocol cannot be identified | flow:to_server keyword |
| Fragmented TLS Handshakes | Premature drops before SNI or Host headers are visible | "Application drop established" action |
| Mid-stream Exceptions | Silent packet drops and high latency | Set Stream exception policy to "Continue" |
Reducing False Positives in Managed Rule Groups
Fine-tuning firewall rule groups to minimise false positives is essential to maintain strong yet adaptable security. Managed rule groups are designed to block malicious traffic automatically, but they can sometimes flag legitimate activities. Addressing these false positives is crucial to avoid interrupting normal operations while still protecting your network.
Using Alert Mode for Managed Rule Groups
The alert mode feature changes all drop actions in a managed rule group to alert actions. This means that traffic which would have been blocked is instead allowed to pass through, while generating alerts in your firewall logs. Essentially, alert mode provides a way to test the firewall’s blocking behaviour without enforcing it.
Before deploying your firewall in a live environment, enable alert mode and logging to identify potential false positives. If you notice legitimate traffic being flagged, you can adjust the rule group by going to the Firewall policy page. Under the Rule group details section, locate the stateful rule group in question and set the Run in alert mode option to Enabled.
Once you've identified problematic rules, you can refine your setup by disabling specific drop actions to address false positives more precisely.
Disabling Specific Drop Actions
After spotting a false positive in your logs, focus on the specific rule group causing the issue. Enable alert mode for that group while keeping other groups in drop mode.
Next, review your Network Firewall logs, which can be stored in Amazon S3, CloudWatch Logs, or Amazon Kinesis Data Firehose. Look for the rule ID (or SID) responsible for the false positive. If your firewall is set to a strict evaluation order with a default action of Drop established, ensure that an alert action like Alert all or Alert established is also enabled. Without this, dropped traffic won’t generate logs, making it difficult to troubleshoot. For further assistance with problematic rules in AWS managed rule groups, reach out to the AWS Support Centre.
| Tool | Purpose | Configuration Impact |
|---|---|---|
| Alert Mode | Monitors rule triggers without blocking traffic | Overrides drop to alert |
| Alert Logs | Identifies the specific rule group and SID causing blocks | Requires logging to S3, CloudWatch, or Kinesis |
| Rule Group Override | Isolates problematic groups while maintaining security | Applied at the firewall policy level |
Fixing Asymmetric Routing and Rule Symmetry Issues
Asymmetric routing happens when request and response traffic take different paths. AWS Network Firewall needs both directions of a connection to pass through the same firewall endpoint for proper stateful inspection to work.
When traffic flows aren't symmetrical, the stateful engine can't track the connection state or perform application-layer inspections. This means it misses the TCP handshake, which causes HTTP or TLS inspections to fail. Packets forwarded asymmetrically are flagged by the stream exception policy and dropped immediately. This can lead to sporadic connection failures and increased latency, which can be tough to troubleshoot.
Identifying Routing Problems with VPC Reachability Analyzer
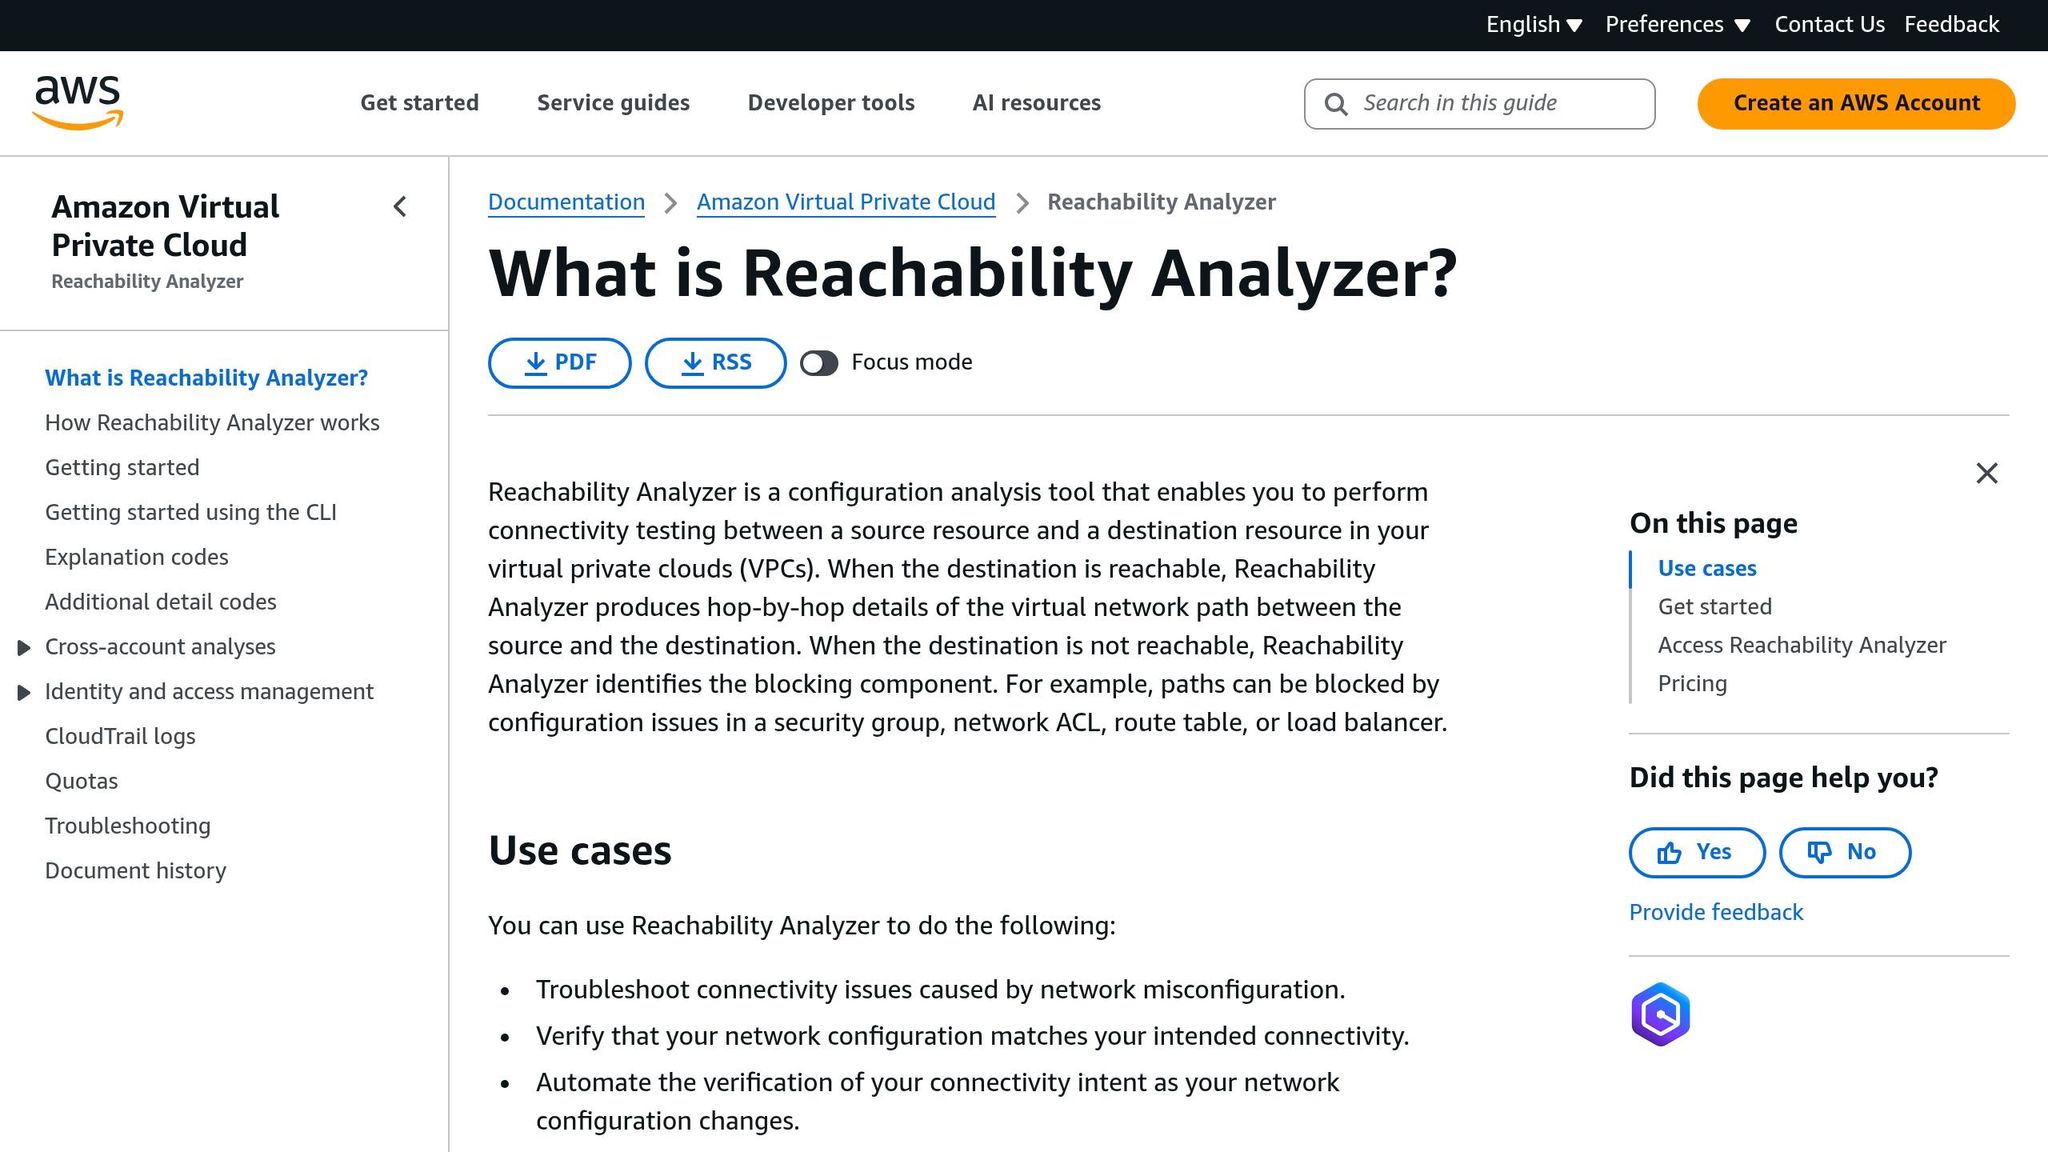
The VPC Reachability Analyzer can trace the exact route traffic takes between its source and destination, helping you identify routing issues using specific error codes. For instance:
- If you encounter the error
TRANSIT_GATEWAY_APPLIANCE_MODE_RECOMMENDED, it suggests enabling appliance mode on your Transit Gateway VPC attachment to ensure both request and response flows stay within the same Availability Zone. - The error
RESPONSE_RTB_HAS_NO_ROUTE_TO_TRANSIT_GATEWAYindicates that while traffic reaches the VPC endpoint, there's no valid return route back to the transit gateway.
To manually confirm traffic symmetry, you can create a test Suricata rule like this: alert tcp any any -> any any (msg:"Routing is symmetric"; flow:established; sid:123456;). If the alert log shows app_proto: tls or flow:established, the firewall is correctly observing both directions of the connection. Additionally, monitoring the StreamExceptionPolicyPackets metric in CloudWatch can help pinpoint asymmetric routing issues.
Once you've verified that routing paths are symmetrical, you need to ensure that stateless rules are properly configured for bidirectional flows.
Pairing Forward and Return Rules for Stateless Configurations
Unlike stateful rules, which automatically track traffic, stateless configurations evaluate each packet independently. This means you need to manually create rule pairs for bidirectional traffic. For every stateless rule allowing traffic from source A to destination B, you must add a matching rule for traffic from B to A. In these reciprocal rules, the destination ports in the forward rule should become the source ports in the return rule to maintain symmetry.
To simplify this process, use the Analyse feature in the AWS Management Console or the AnalyseRuleGroup API to identify rules that might lead to asymmetric forwarding. Unidirectional pass rules in a stateless rule group can cause asymmetric forwarding, especially if the firewall policy’s default action is set to "Forward to stateful rule groups". In centralised deployment models using AWS Transit Gateway, enabling Appliance Mode on the VPC attachment ensures flow symmetry by using the same network interface for the entire connection.
Creating Custom Suricata Rules and Managing SIDs
Building on earlier troubleshooting techniques, creating custom rules gives you greater control over traffic inspection. In AWS Network Firewall, every stateful rule requires a unique SID (Signature ID) to ensure accurate log tracking. These SIDs act as identifiers, helping you pinpoint which specific rule triggered an action or alert in your firewall logs. Without a clear SID strategy, troubleshooting can become a headache, as identifying the root cause of specific behaviours in your logs becomes much harder.
Preventing SID Conflicts Across Rule Groups
When SIDs are duplicated across rule groups, it creates confusion in logs and makes troubleshooting more challenging. If multiple rules share the same SID, it becomes impossible to tell which rule group triggered the alert. To avoid this, assign unique SID ranges to each rule group. For instance:
- Group A: 1,000,000–1,999,999
- Group B: 2,000,000–2,999,999
This approach allows you to quickly identify the source rule group during log analysis without needing to cross-check multiple configurations.
Correct Rule Ordering in Suricata
Getting the order of Suricata rules right is key to ensuring application-layer protocols are inspected properly. AWS Network Firewall provides two evaluation methods: Action Order (default) and Strict Order.
- Action Order processes rules by action type -
pass, thendrop, thenreject, thenalert- ignoring the order in which you wrote them. - Strict Order, on the other hand, processes rule groups by priority (starting with the lowest number) and evaluates rules within those groups exactly as listed, from top to bottom. AWS recommends using Strict Order for troubleshooting, as it offers more precise control.
One common mistake is placing a generic TCP rule ahead of a protocol-specific rule. For example, a generic pass tcp rule for port 80 might inadvertently allow traffic, even if a later rule is meant to block HTTP requests. This happens because the firewall processes the TCP handshake before seeing the HTTP host header, causing the generic rule to match first. Adding flow:to_server to the rule can delay evaluation until the HTTP protocol is detected, ensuring the correct rule takes effect.
When using Strict Order, always place specific "pass" or "reject" rules for domains or URLs above broader "drop" or "pass" rules for ports. These practices enhance your custom rule configuration and align with the broader troubleshooting strategies discussed earlier.
Using Logs to Debug Firewall Rules
Logs are an essential tool for understanding how your firewall rules are performing. Once you've set up custom Suricata rules and determined their evaluation order, logs become your go-to resource for verifying their behaviour. AWS Network Firewall offers three types of logs: Flow, Alert, and TLS, all formatted in EVE JSON.
Firewall logs only capture traffic that matches actions like drop, alert, or reject. If you need to debug why certain traffic is being allowed, you can add the alert modifier to your pass rules. For instance, a rule like pass tls $HOME_NET any -> $EXTERNAL_NET any (... alert; sid:222222;) will log allowed traffic. Without this modifier, allowed traffic flows through unnoticed, leaving no trace in your logs.
How to Enable Flow and Alert Logs
Logs can be routed to Amazon S3, Amazon CloudWatch Logs, or Amazon Kinesis Data Firehose, but only for traffic processed by the stateful rules engine. If you're using a strict evaluation order with a "Drop established" default action, consider switching to "Alert established" or "Alert all" to capture logs for dropped traffic.
To identify flows exceeding inspection depth, use the stream-event:reassembly_depth_reached; keyword in your alert rules. Ensure your IAM policy allows actions like logs:CreateLogDelivery and logs:PutResourcePolicy. Once logging is enabled, you can use AWS tools to analyse the data in real time.
Analysing Rules with AWS Console Tools
The Monitoring tab in the VPC console is a great starting point for real-time log analysis. It provides visuals of flow and alert logs, showing key metrics like top source and destination IPs, protocols, and domain activity. For the best results, configure both flow and alert logs. The dashboard can display activity for the top 10, 50, or 100 domains, and the Traffic Analysis Mode lets you generate reports on HTTP/HTTPS traffic from the past 30 days.
For deeper insights, CloudWatch Logs allows you to search for specific fields such as signature_id (to identify the rule), action (to see the firewall's decision), and tls_inspected (to check if TLS inspection was active). If your logs are stored in Amazon S3, you can query them using Amazon Athena for retroactive analysis. Keep in mind, though, that each query or time range adjustment incurs additional costs, as Network Firewall queries your logging destinations.
Using logs effectively is a key part of refining your firewall rules, complementing the troubleshooting techniques you've already applied.
Conclusion: AWS Network Firewall Troubleshooting Summary
When troubleshooting AWS Network Firewall rules, there are three main areas to focus on: rule evaluation order, variable configuration, and logging.
One critical aspect is understanding the stateful engine's default "Action Order". By default, pass rules take precedence over drop rules, no matter their position in the rule set. This can unintentionally allow unwanted traffic. Switching to Strict Order ensures rules are processed predictably, from top to bottom, as they appear in the list.
Next, variable configuration is a frequent stumbling block, especially in centralised inspection setups. For instance, the HOME_NET variable must be correctly configured. If the default CIDR isn’t updated to include the CIDR ranges of spoke VPCs, the EXTERNAL_NET variable (which is automatically defined as its negation) might be set incorrectly. This can lead to rules failing or even allowing untrusted traffic . Additionally, ensure routing symmetry is intact to avoid unexpected behaviour.
Logging is another key tool for understanding rule behaviour. Keep in mind that standard pass rules don’t generate logs by default. To track allowed traffic, you can append the alert modifier. Enabling both flow and alert logs gives a more complete view of what’s happening. Analysing these logs with tools like CloudWatch or Amazon Athena can help you spot traffic patterns or anomalies . If you encounter issues where traffic exceeds inspection limits, the stream-event:reassembly_depth_reached keyword can help pinpoint mismatches.
Finally, continuous monitoring ties everything together. Automating alerts using CloudWatch and EventBridge ensures real-time detection of security events. When deploying managed rule groups, starting in Alert mode is a good practice. This allows you to identify false positives without disrupting legitimate traffic. Be aware that firewall policy changes may take several minutes to propagate, which can cause temporary inconsistencies.
These targeted steps provide a clear path to troubleshoot AWS Network Firewall effectively, ensuring a secure and well-monitored network environment.
FAQs
Which rule order should I choose for production?
For production environments, it's important to use a strict rule order. This ensures that your rules are evaluated in the precise sequence you set. By doing so, you can maintain predictable traffic processing and keep control over how it is managed.
Why is my traffic being dropped only sometimes?
Intermittent traffic drops in AWS Network Firewall can usually be traced back to a few common culprits: asymmetric routing, misconfigured rules, or incorrect rule ordering and actions. For example, setting up the HOME_NET variable incorrectly or having conflicts between stateful and stateless rules can lead to unexpected behaviour.
To address these issues, start by reviewing your rule configurations carefully. Check for any routing problems that might be causing traffic to deviate. Additionally, enabling logging can help you identify exactly where and why traffic is being dropped, allowing for quicker resolution.
How can I log allowed traffic?
To monitor allowed traffic in AWS Network Firewall, you need to enable logging and set up a destination for the logs. Start by adding the alert keyword to your pass rules, which will create alert logs for the traffic you allow. You can send these logs to Amazon CloudWatch Logs by creating a log group and configuring your firewall to deliver the logs there. Make sure logging is turned on, and the log group is properly configured to ensure effective monitoring.